Fig. 2
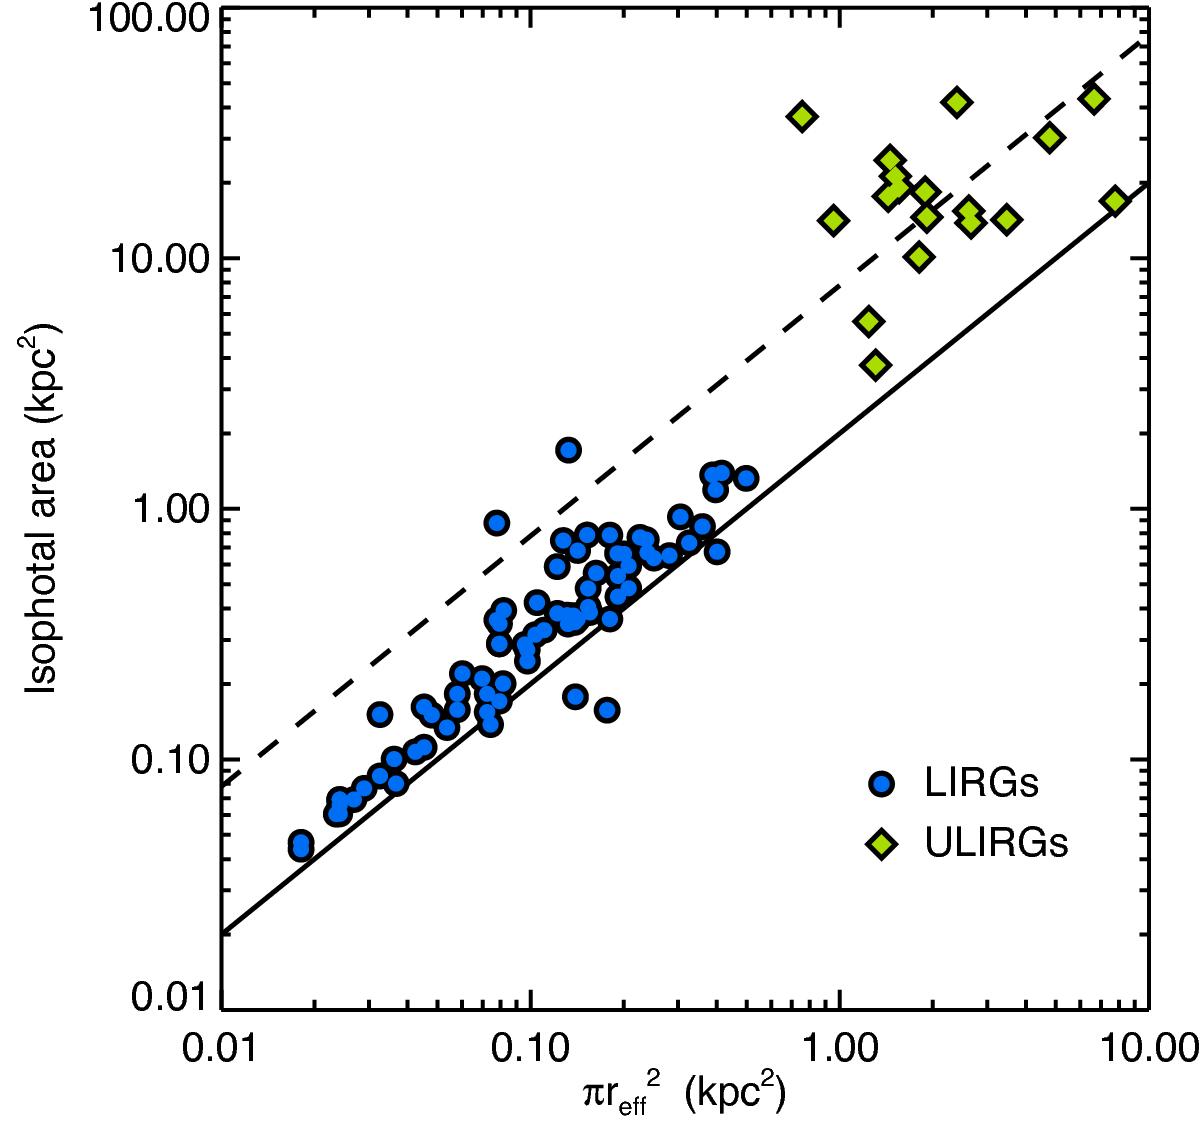
Comparison between the isophotal area (region enclosed by an isophote of 10-18 erg s-1 cm-2) and the circular area obtained from the reff of the individual star-forming regions in LIRGs (circles) and ULIRGs (diamonds). The thick black line represents the ratio between both quantities for a region with a uniform flux distribution, whereas the dashed line represents the same ratio for a region with a symmetric 2D Gaussian light profile and a total flux of 10-13 erg s-1 cm-2.
Current usage metrics show cumulative count of Article Views (full-text article views including HTML views, PDF and ePub downloads, according to the available data) and Abstracts Views on Vision4Press platform.
Data correspond to usage on the plateform after 2015. The current usage metrics is available 48-96 hours after online publication and is updated daily on week days.
Initial download of the metrics may take a while.