Fig. A.1
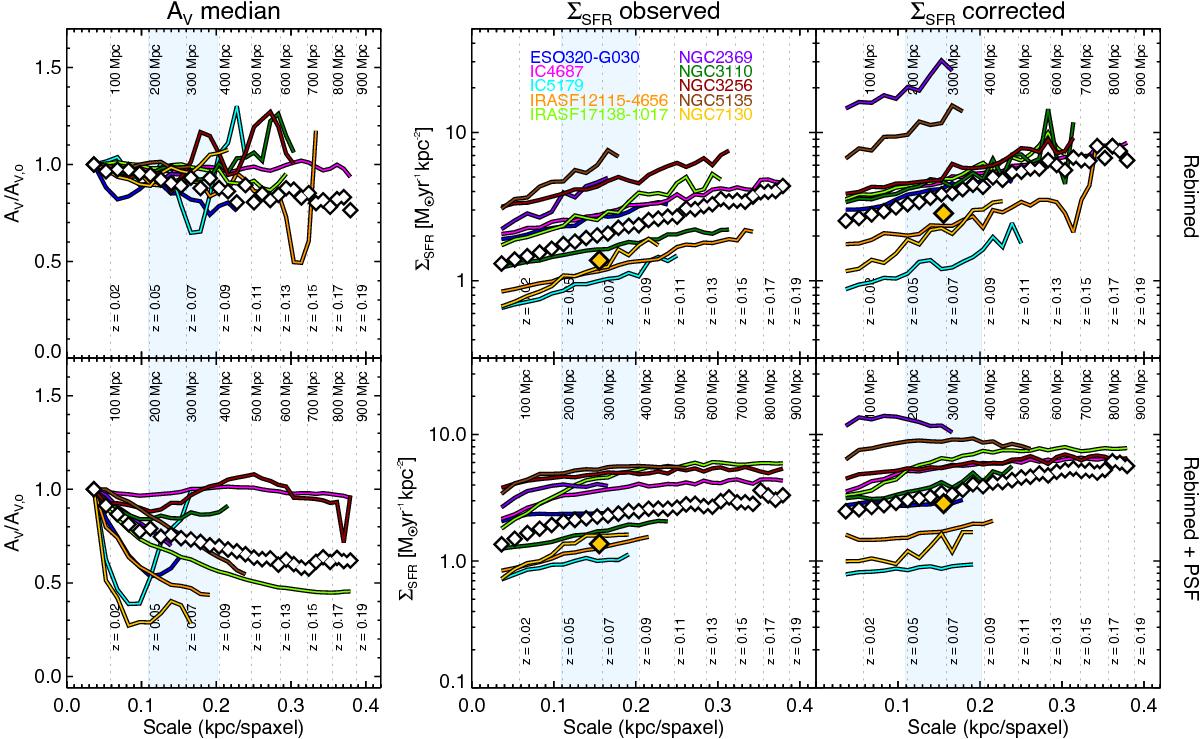
Evolution of the computed median AV and ΣSFR of the spaxel-by-spaxel LIRG distributions, as a function of distance/scale. Upper panels correspond to simulations where the maps are only rebinned, whereas lower panels show the results from rebinning and smearing the maps as a result of the effect of seeing (see text for details). Colour lines represent the evolution of the median of each individual distribution, whereas white diamonds show the median of the whole LIRG distribution. The median ΣSFR values of the ULIRG distributions within rLIRGs = 1.4 kpc are also plotted as yellow diamonds, for reference.
Current usage metrics show cumulative count of Article Views (full-text article views including HTML views, PDF and ePub downloads, according to the available data) and Abstracts Views on Vision4Press platform.
Data correspond to usage on the plateform after 2015. The current usage metrics is available 48-96 hours after online publication and is updated daily on week days.
Initial download of the metrics may take a while.