Fig. 1
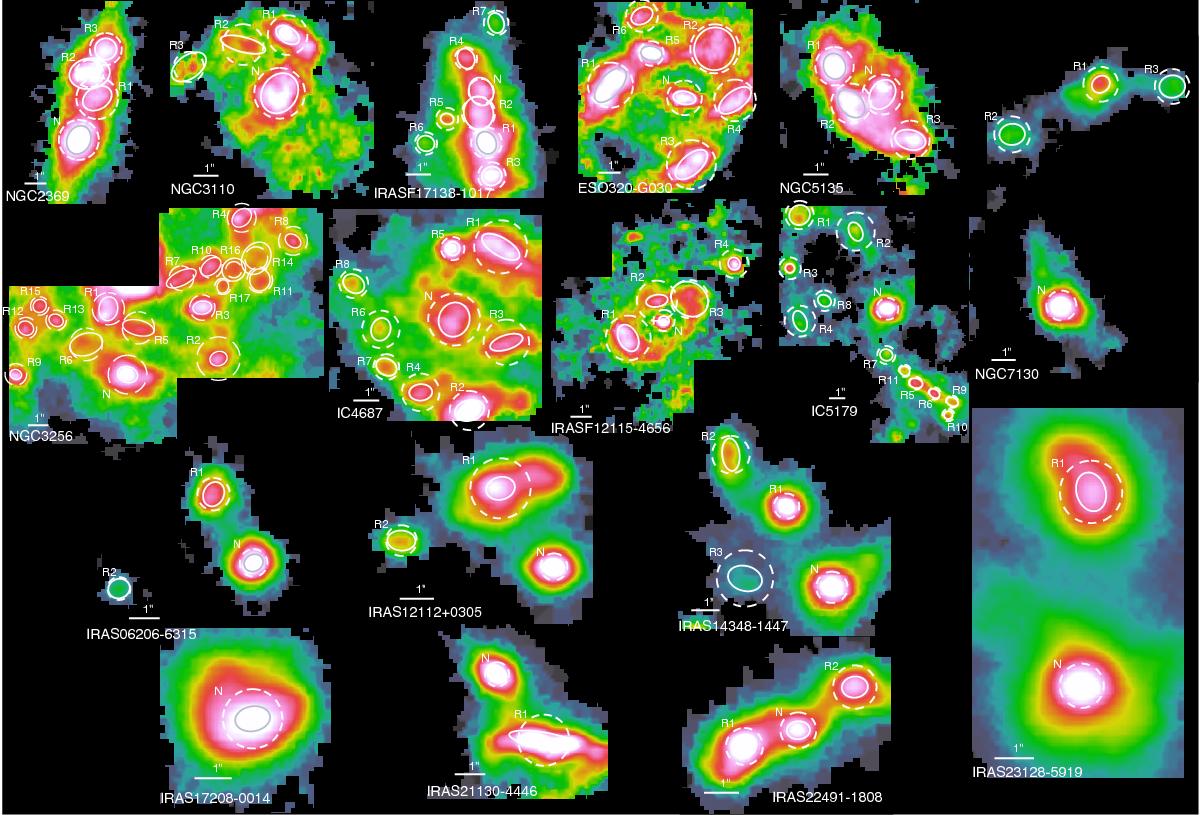
Maps of the observed Brγ (LIRGs) and Paα (ULIRGs) emission. The angular scale of each object is indicated by a white horizontal bar that marks 1 arcsec. The nucleus of each object (defined as the brightest region in the K-band continuum, see Paper I) is labeled as “N”, whereas the remaining regions are tagged as “R#” by decreasing total observed flux (see Table B.1). The white (grey) ellipses over each individual region are the 1σ fitting to the 2D Gaussian profile, whereas the white (grey) dashed circles have reff radius. The colour scheme is logarithmic and autoscaled.
Current usage metrics show cumulative count of Article Views (full-text article views including HTML views, PDF and ePub downloads, according to the available data) and Abstracts Views on Vision4Press platform.
Data correspond to usage on the plateform after 2015. The current usage metrics is available 48-96 hours after online publication and is updated daily on week days.
Initial download of the metrics may take a while.