Free Access
Fig. 3
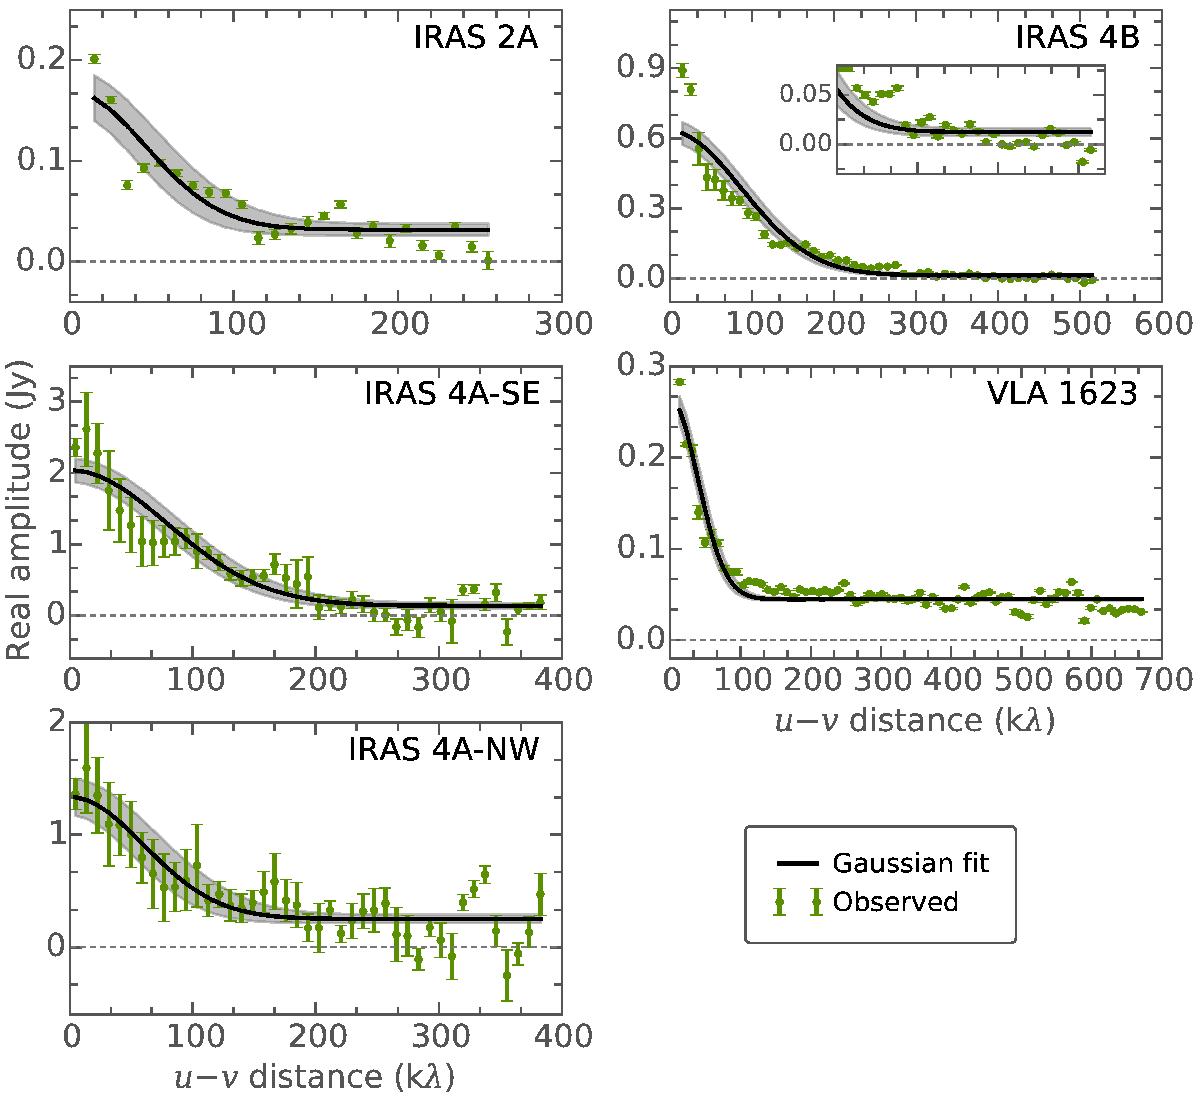
Best-fit Gaussian model with added point source where applicable. The green points are the envelope subtracted and de-projected data with the variance from the binning as uncertainty, while the black line and gray area show the best fit and the 1σ region (changing the fitted parameters by ±1σ).
Current usage metrics show cumulative count of Article Views (full-text article views including HTML views, PDF and ePub downloads, according to the available data) and Abstracts Views on Vision4Press platform.
Data correspond to usage on the plateform after 2015. The current usage metrics is available 48-96 hours after online publication and is updated daily on week days.
Initial download of the metrics may take a while.