Fig. 2
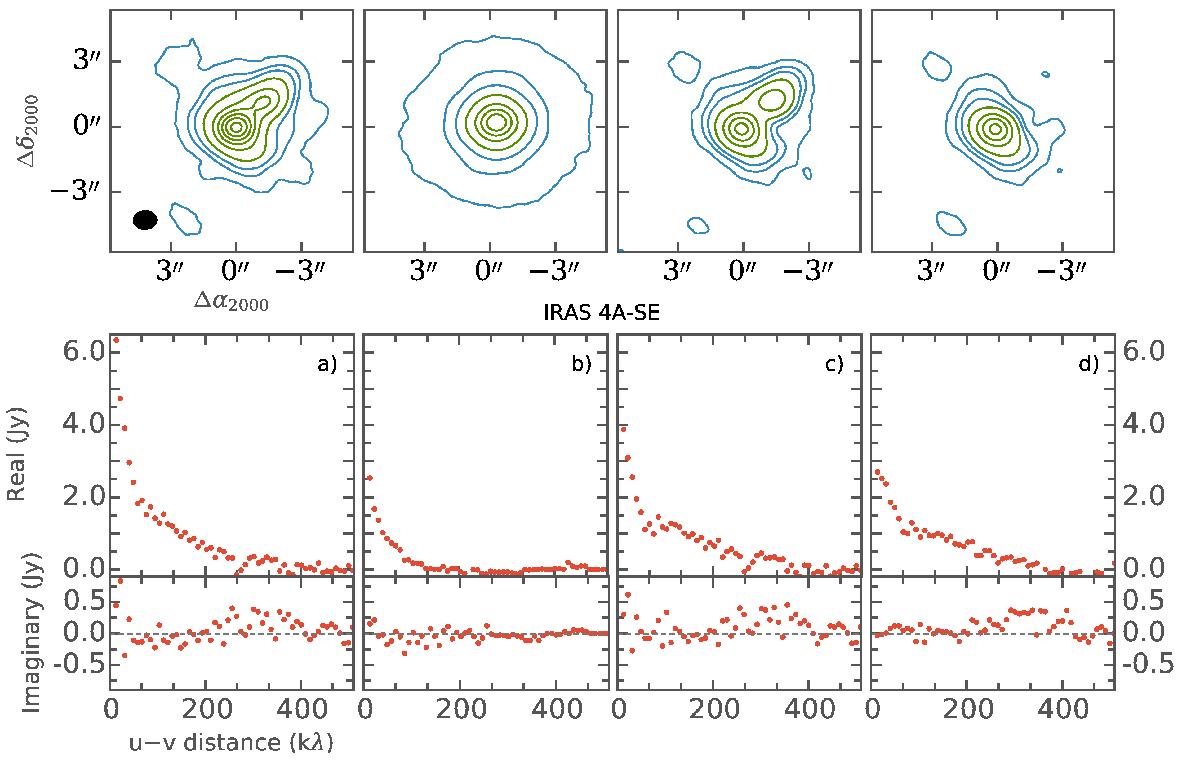
Images and visibilities of data preparation steps for IRAS 4A-SE. Top: imaged data; bottom: binned real and imaginary visibilities. From left to right: a) raw data; b) envelope model; c) raw data with envelope subtracted; d) raw data with envelope and companion subtracted. The contours start at 3σ, then in steps of 7σ until 31σ, and then in steps of 31σ, where σ = 10 mJy (5 mJy for envelope model image).
Current usage metrics show cumulative count of Article Views (full-text article views including HTML views, PDF and ePub downloads, according to the available data) and Abstracts Views on Vision4Press platform.
Data correspond to usage on the plateform after 2015. The current usage metrics is available 48-96 hours after online publication and is updated daily on week days.
Initial download of the metrics may take a while.