Fig. A.2
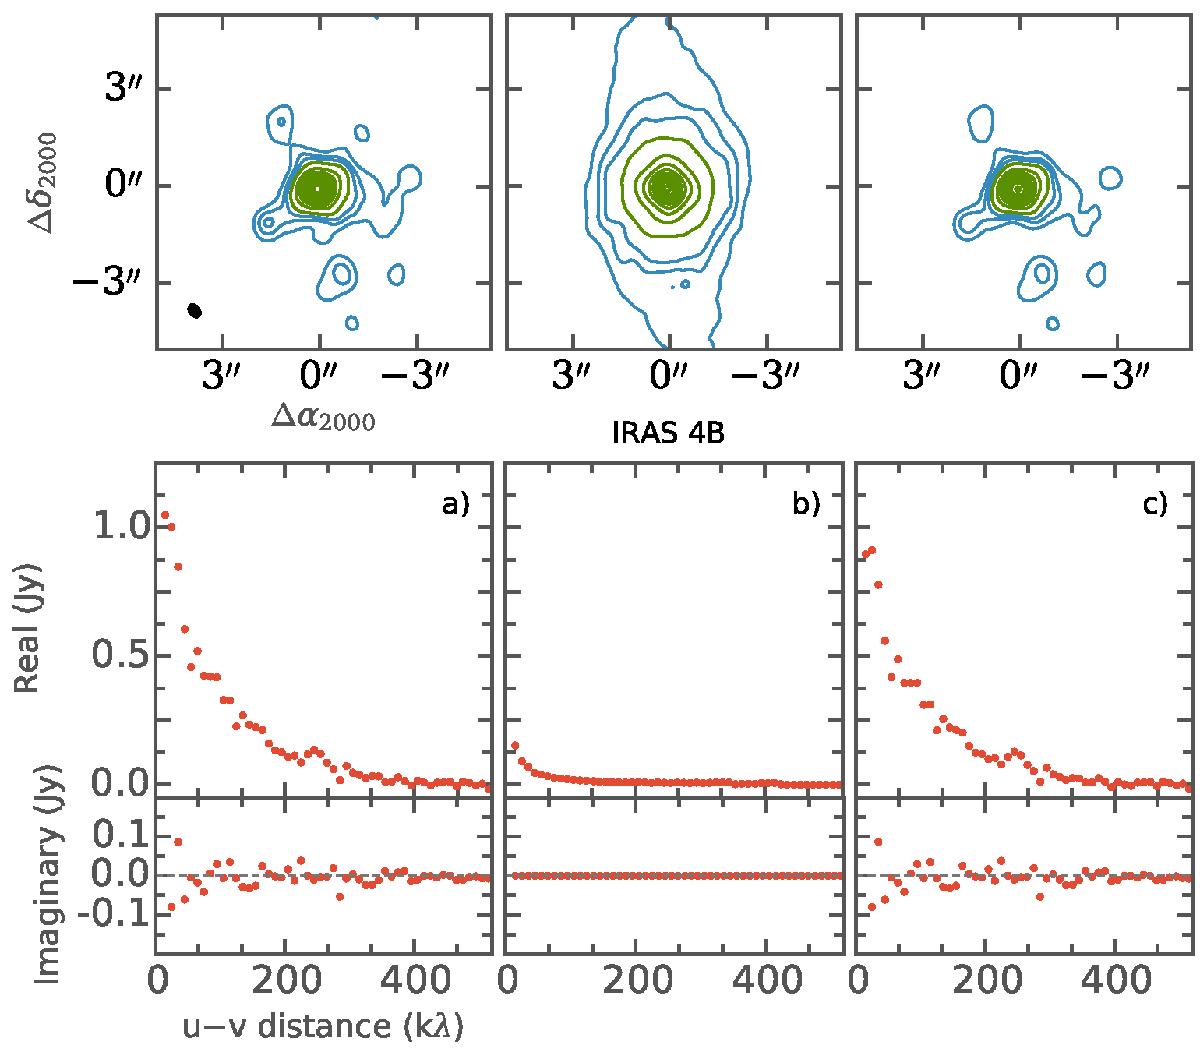
Images and visibilities of data preparation steps for IRAS 4B. From left to right: raw data, envelope model, raw data with envelope subtracted. The images start at 3σ, in steps of 3σ until 15σ where it is in steps of 15σ, σ = 2 mJy (σ = 0.13 mJy for envelope model image). As pointed out in the text, the observations of IRAS 4B are dynamic range limited, which causes the compact emission around the main continuum peak seen in the images above; these are convolution artifacts and are not real.
Current usage metrics show cumulative count of Article Views (full-text article views including HTML views, PDF and ePub downloads, according to the available data) and Abstracts Views on Vision4Press platform.
Data correspond to usage on the plateform after 2015. The current usage metrics is available 48-96 hours after online publication and is updated daily on week days.
Initial download of the metrics may take a while.