Fig. 11
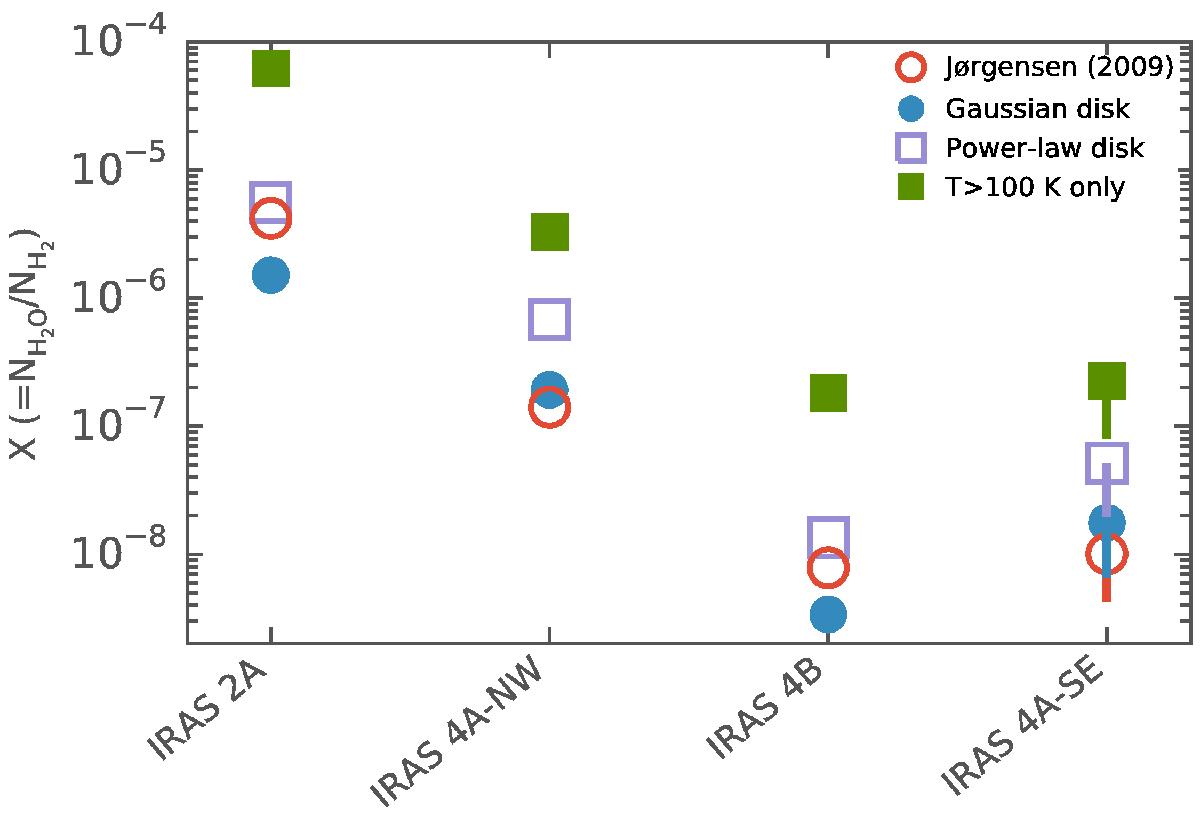
Relative abundance of gas-phase water derived from observations of p-H![]() O by (Persson et al. 2012) and continuum (for estimating the H2 abundance) for different methods of estimating the disk gas mass. The values of the mass by Jørgensen et al. (2009) used by Persson et al. (2012) are drawn as red open circles. The size of the symbols reflects the uncertainty; for IRAS 4A-SE the values are upper-limits.
O by (Persson et al. 2012) and continuum (for estimating the H2 abundance) for different methods of estimating the disk gas mass. The values of the mass by Jørgensen et al. (2009) used by Persson et al. (2012) are drawn as red open circles. The size of the symbols reflects the uncertainty; for IRAS 4A-SE the values are upper-limits.
Current usage metrics show cumulative count of Article Views (full-text article views including HTML views, PDF and ePub downloads, according to the available data) and Abstracts Views on Vision4Press platform.
Data correspond to usage on the plateform after 2015. The current usage metrics is available 48-96 hours after online publication and is updated daily on week days.
Initial download of the metrics may take a while.