Fig. 1
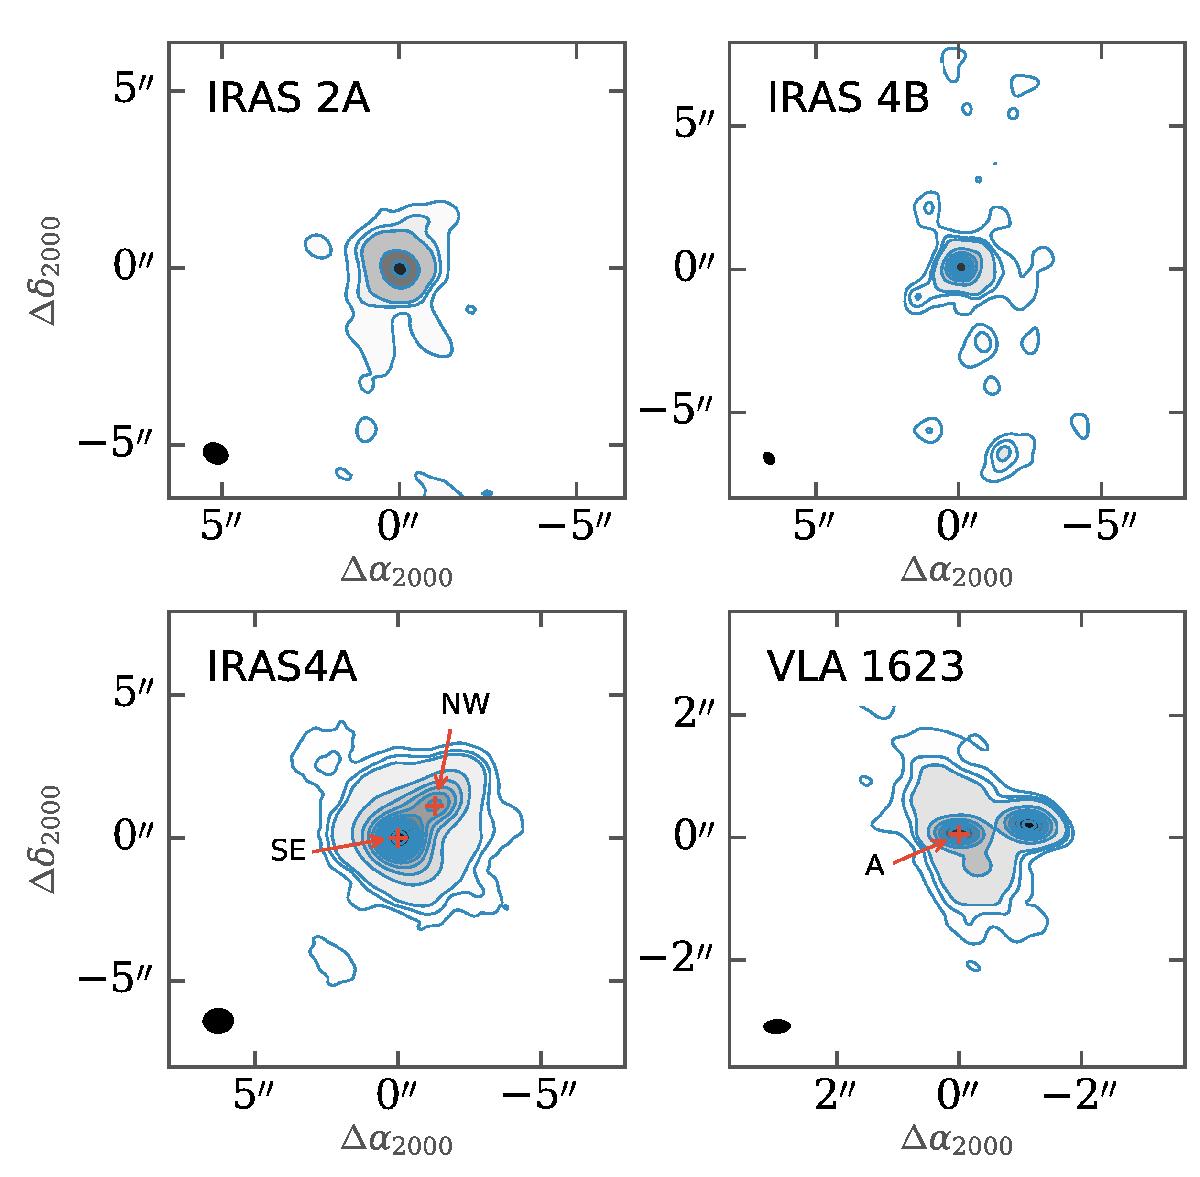
Maps of the continuum toward IRAS 2A (PdBI), IRAS 4B (PdBI), IRAS 4A (SMA), and VLA 1623 (ALMA). Contours start at 3σrms in steps of 3σrms until 9σrms, then in steps of 20σrms (σrms in Table 2). We note the absence of any 2′′ triple toward IRAS 2A. The observations of IRAS 4B are dynamic range limited, causing convolution artifacts to appear around the compact continuum peak; these artifacts are not real (see text).
Current usage metrics show cumulative count of Article Views (full-text article views including HTML views, PDF and ePub downloads, according to the available data) and Abstracts Views on Vision4Press platform.
Data correspond to usage on the plateform after 2015. The current usage metrics is available 48-96 hours after online publication and is updated daily on week days.
Initial download of the metrics may take a while.