Fig. B.2
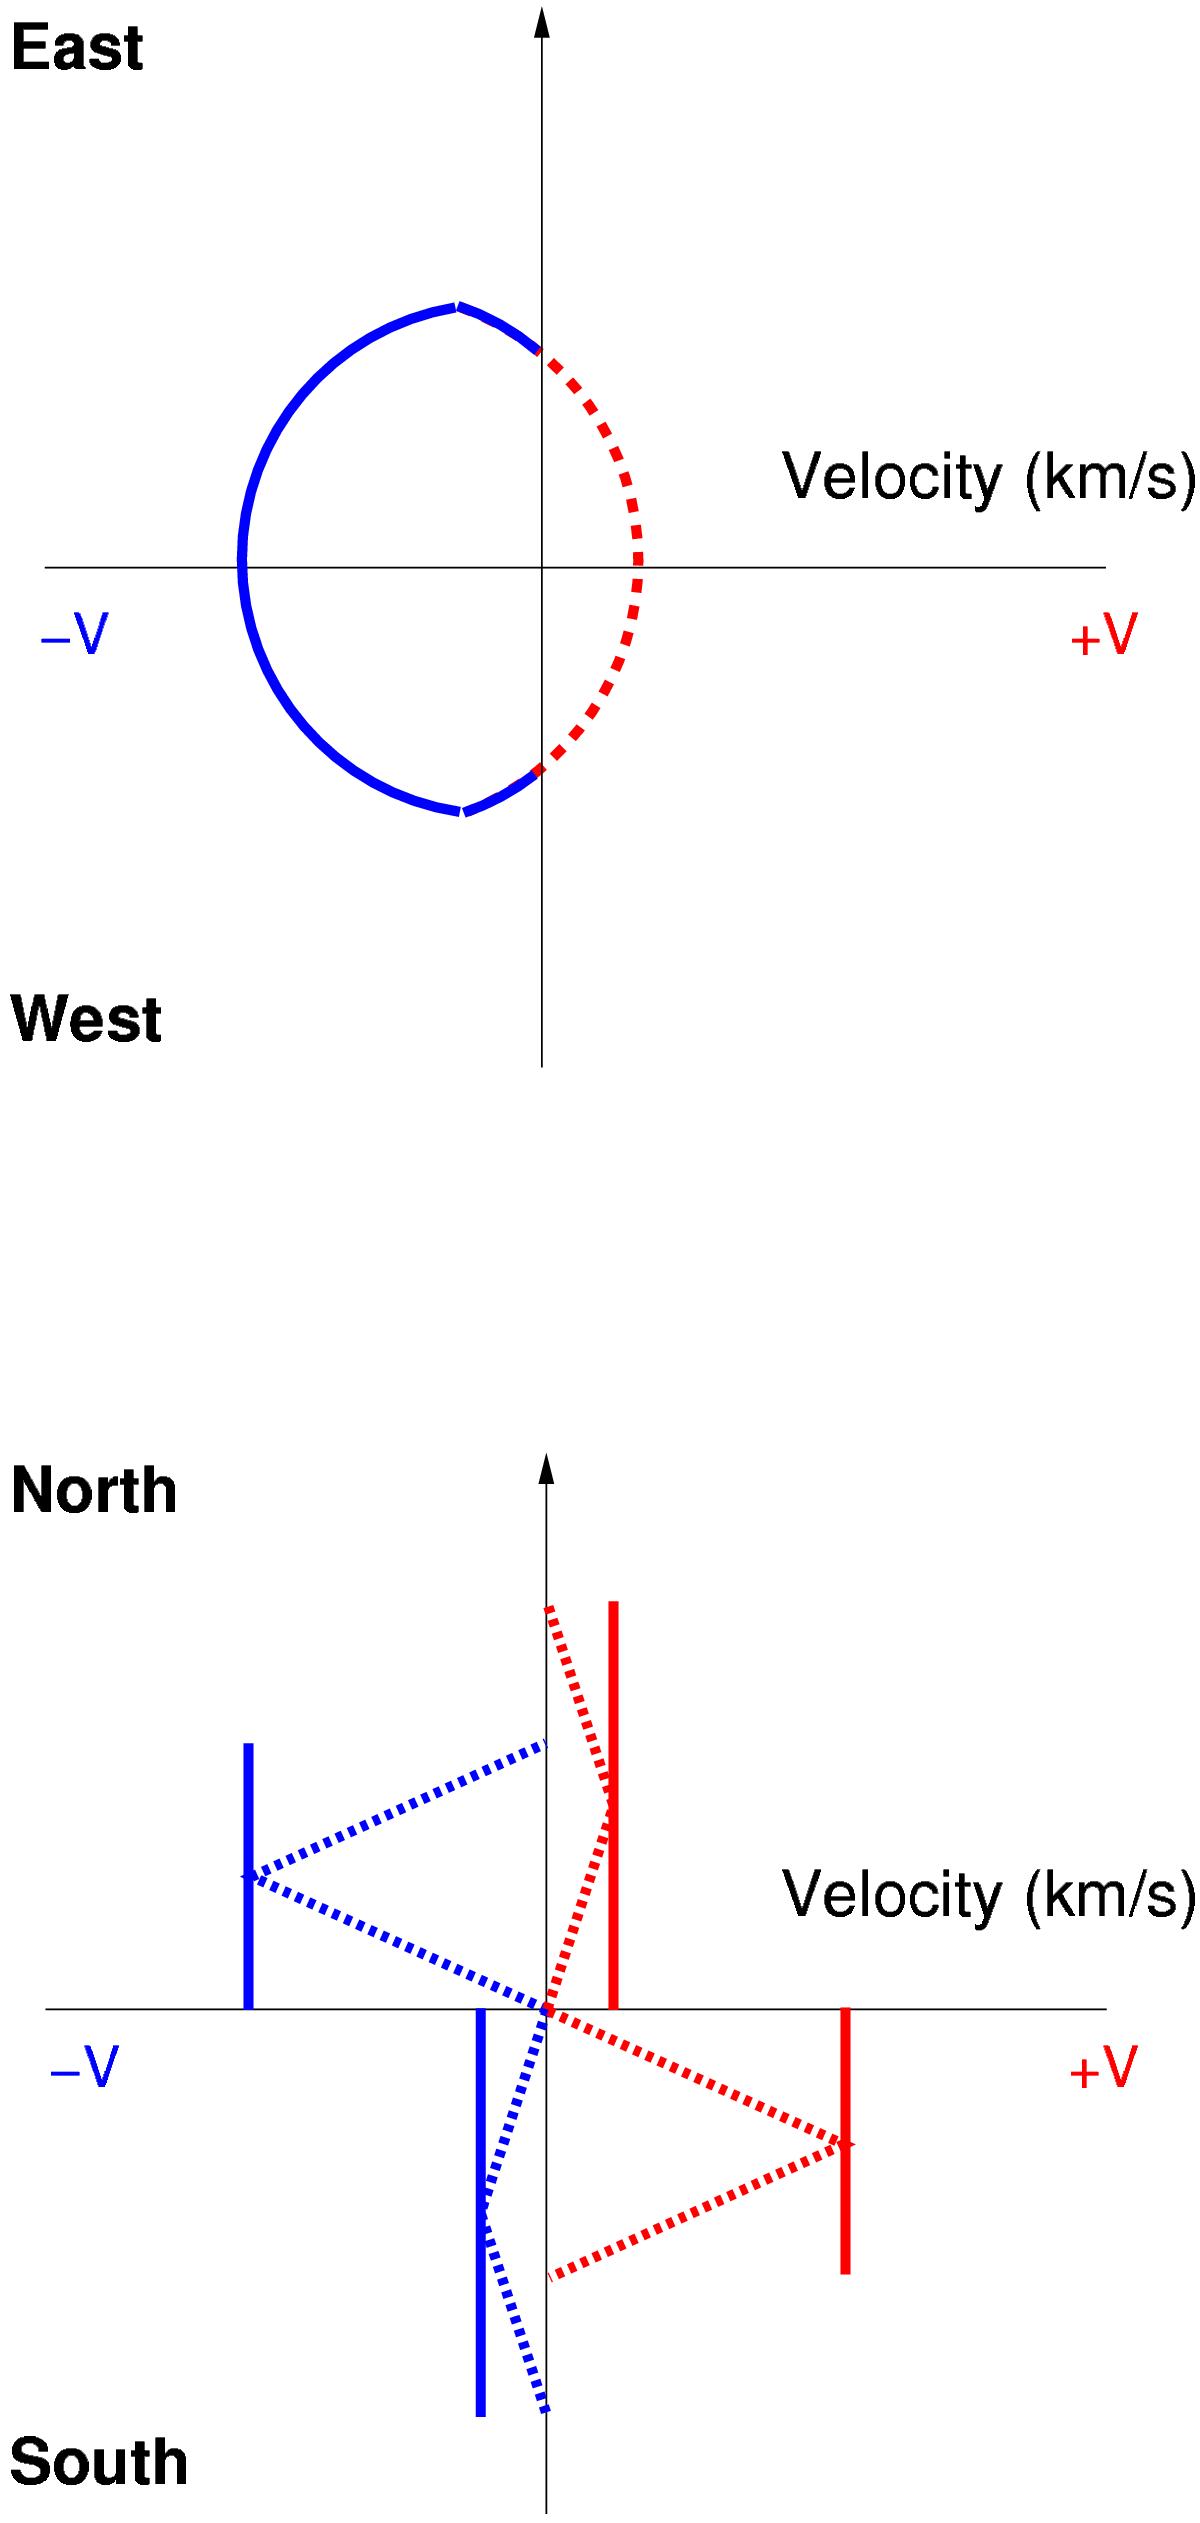
Schematic PV diagrams of a cone with its top (northern) part tilted towards us. Top panel: cut perpendicular to the cone axis showing the elliptical PV diagram through the cone. Bottom panel: cut along the cone major axis. We show two simplified cases: the straight solid lines show the PV diagram of outflowing gas along the cone walls of constant velocity. The dashed lines show the generic PV diagram along the axis of a cone where the gas is first linearly accelerating and then decelerating to zero velocity.
Current usage metrics show cumulative count of Article Views (full-text article views including HTML views, PDF and ePub downloads, according to the available data) and Abstracts Views on Vision4Press platform.
Data correspond to usage on the plateform after 2015. The current usage metrics is available 48-96 hours after online publication and is updated daily on week days.
Initial download of the metrics may take a while.