Fig. A.1
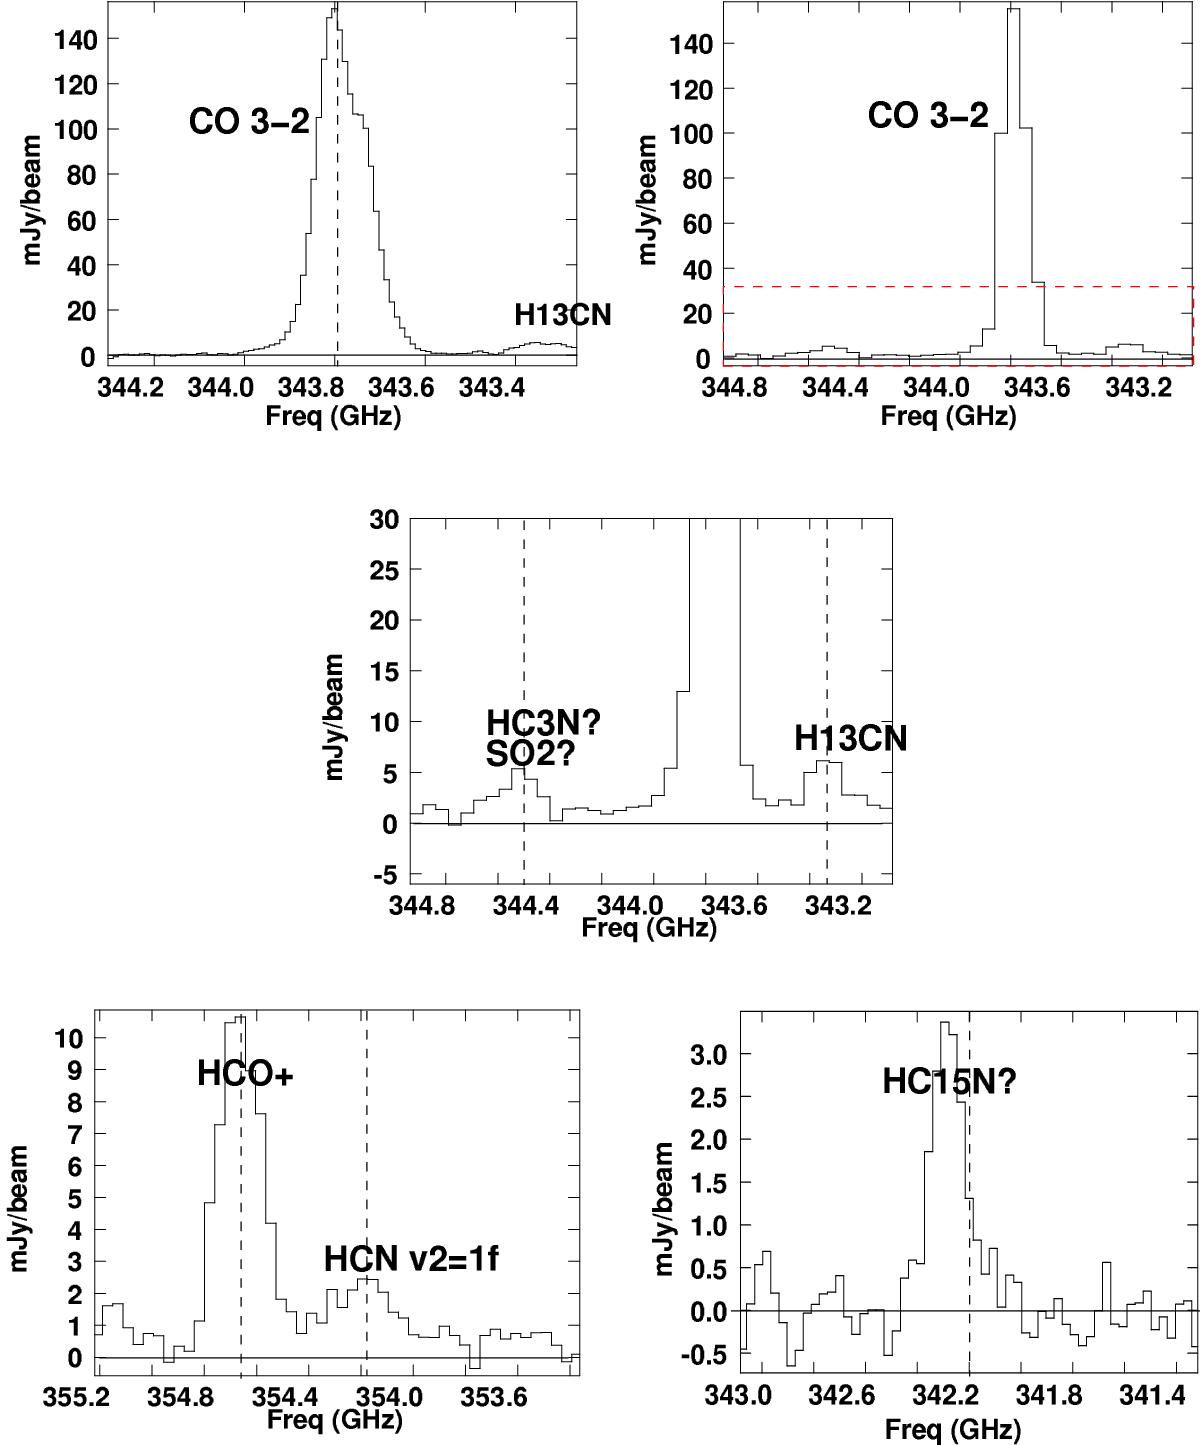
Spectra of the nuclear emission in NGC 1377. Dashed vertical line indicates v = 1740km s-1. Top panels: CO 3−2 in high- (left) and low- (right) resolution spectral mode. The dashed red box of the right panel indicates the zoomed-in region in the next panel. Centre: zoomed-in spectrum showing detections of H13CN J = 4−3 and either HC3N J = 38 − 37ν4 = 1, ν7 = 1 or SO2 16(4,12)−16(3,13). Bottom: panels showing detections of HCO+J = 4−3, HCN J = 4 − 3ν2 = 1f (left) and a line that we tentatively identify as HC15N J = 4 − 3. All spectra apart from in panels 2 and 3 have Gaussian smoothed with FWHM of two channels. In panels 2 and 3 there has been no smoothing but frequency resolution is reduced by a factor of 3 (these data stem from another spectral window than that presented in the first panel).
Current usage metrics show cumulative count of Article Views (full-text article views including HTML views, PDF and ePub downloads, according to the available data) and Abstracts Views on Vision4Press platform.
Data correspond to usage on the plateform after 2015. The current usage metrics is available 48-96 hours after online publication and is updated daily on week days.
Initial download of the metrics may take a while.