Free Access
Fig. 6
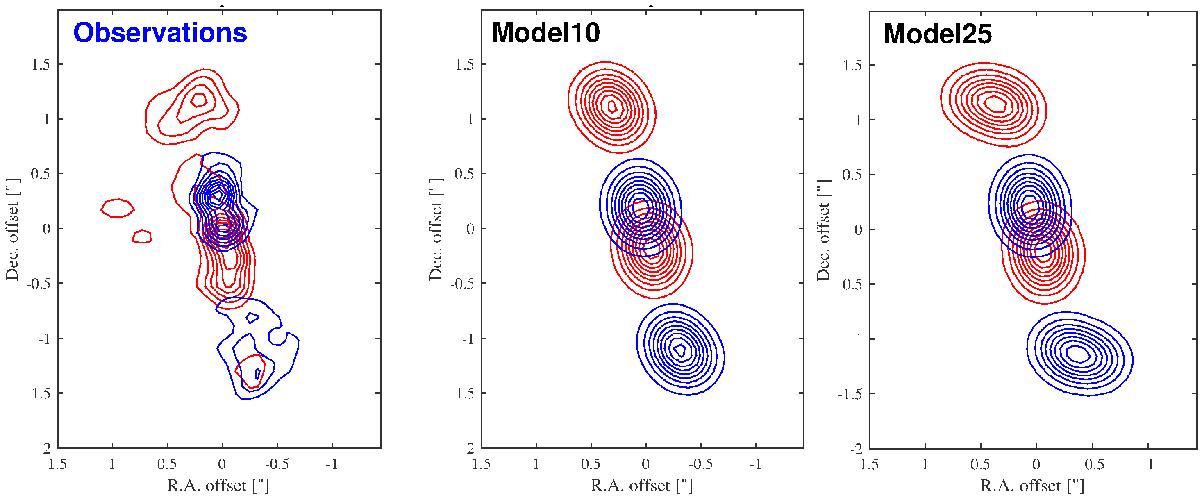
Contour plots of integrated red- and blueshifted emission (>±60 km s-1) for ALMA data (right) and model of precessing jet (left): the precession angle is 10° (centre) and 25° (right) the inclination of the model precession axis along the line of sight is close to zero.
Current usage metrics show cumulative count of Article Views (full-text article views including HTML views, PDF and ePub downloads, according to the available data) and Abstracts Views on Vision4Press platform.
Data correspond to usage on the plateform after 2015. The current usage metrics is available 48-96 hours after online publication and is updated daily on week days.
Initial download of the metrics may take a while.