Fig. 5
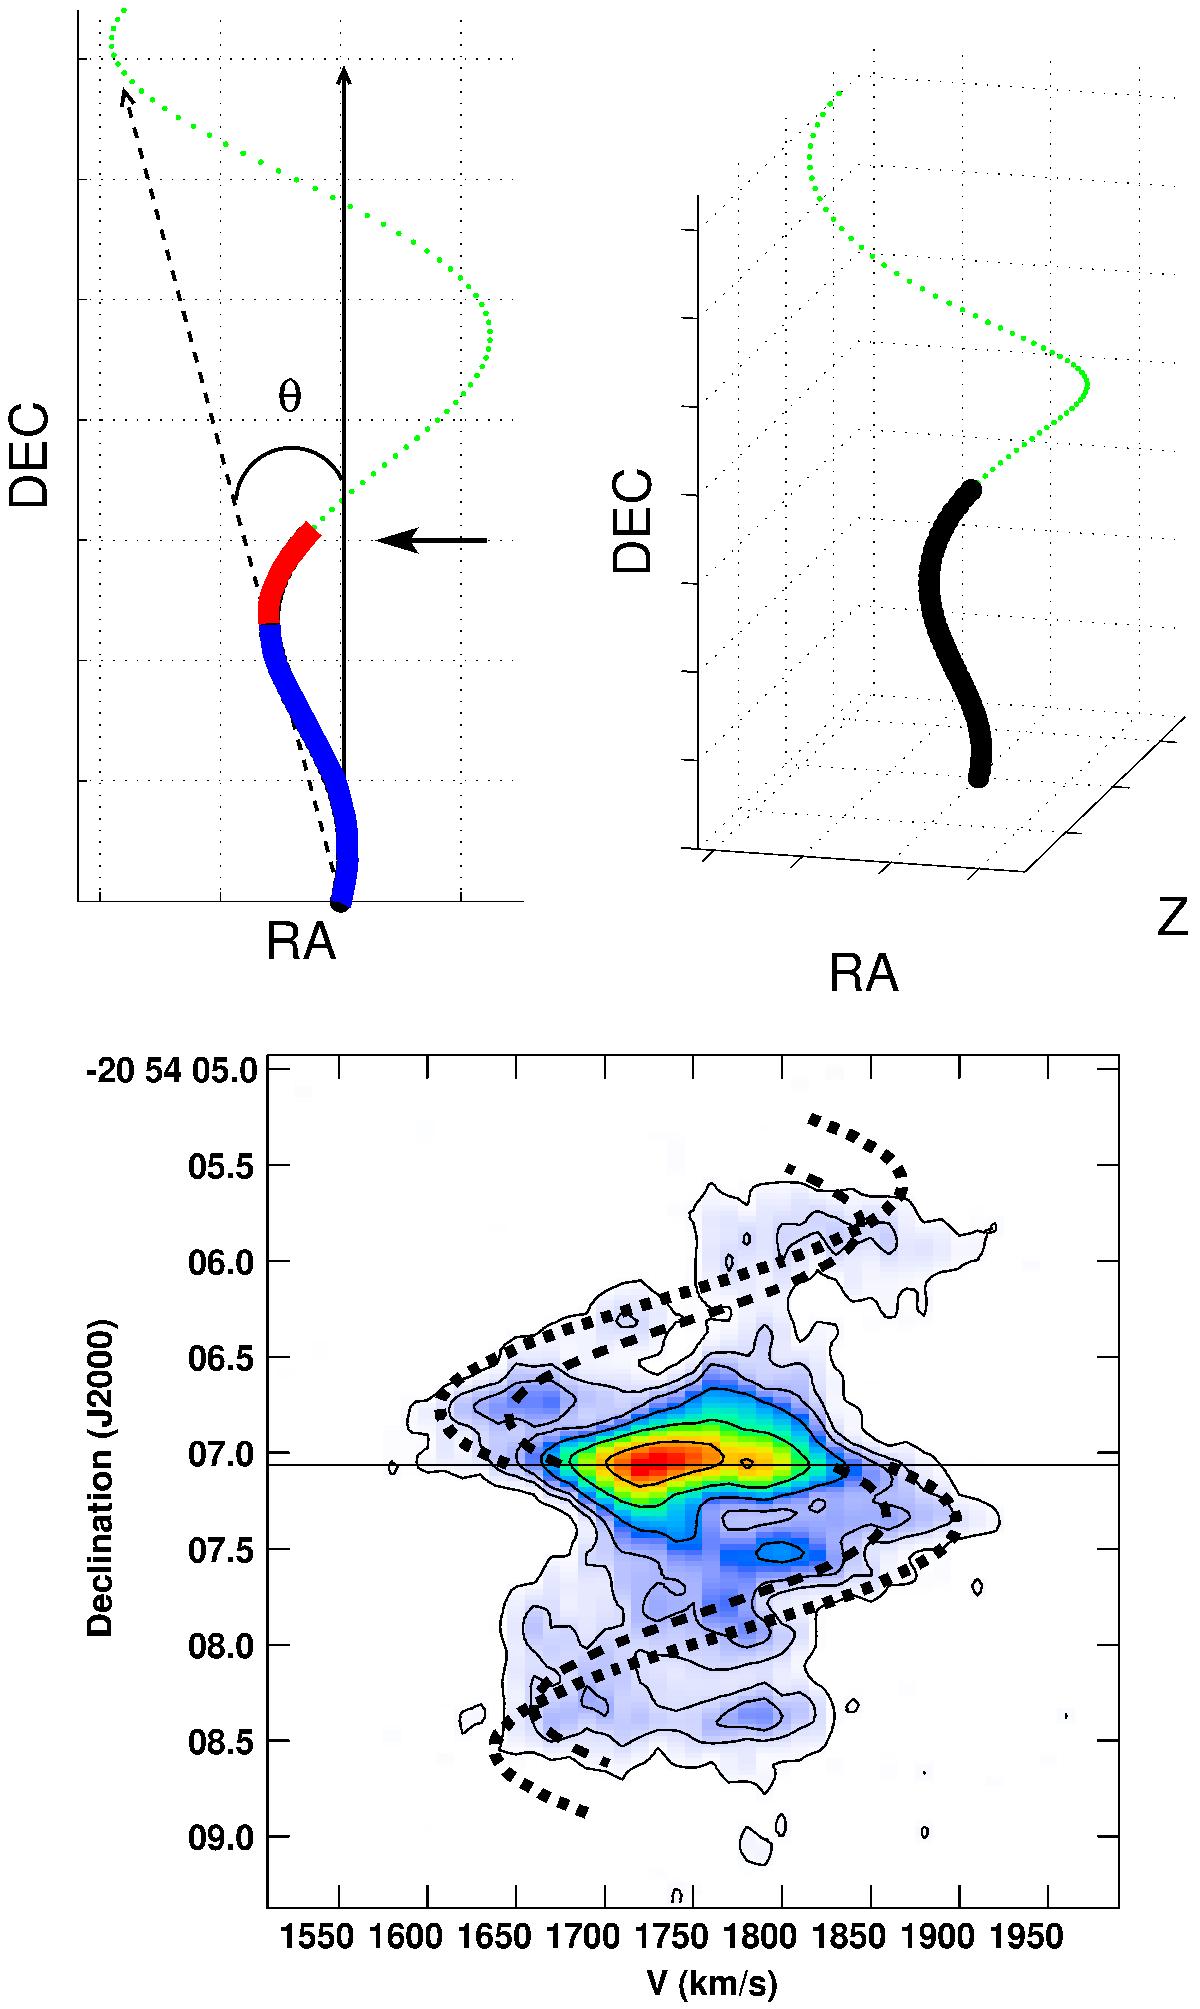
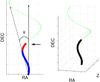
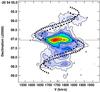
Simple schematic jet model where we have rotated the jet symmetry axis from PA = 10° to 0°. Top: to the right, the northern part of the jet viewed face on. The curve indicates the pattern of the jet path on the sky and the blue and red colours indicate blue- and redshifted emission in the sight-line. The precession angle here is θ = 15° and the arrow indicates where the CO 3−2 emission in the jet ends. The right panel shows the jet viewed from an angle of 45° to illustrate its 3D nature. Bottom: the observed PV diagram along the jet axis (panel A in Fig. 3) with the superposed tracks of a precessing jet of θ = 15° and outflowing velocity vout = 390km s-1 and vout = 520km s-1 indicated with dashed curves. (These values are within the range for θ and vout discussed in Sect. 4.1.2.) We assume vout to be constant and a jet without width.
Current usage metrics show cumulative count of Article Views (full-text article views including HTML views, PDF and ePub downloads, according to the available data) and Abstracts Views on Vision4Press platform.
Data correspond to usage on the plateform after 2015. The current usage metrics is available 48-96 hours after online publication and is updated daily on week days.
Initial download of the metrics may take a while.