Fig. 3
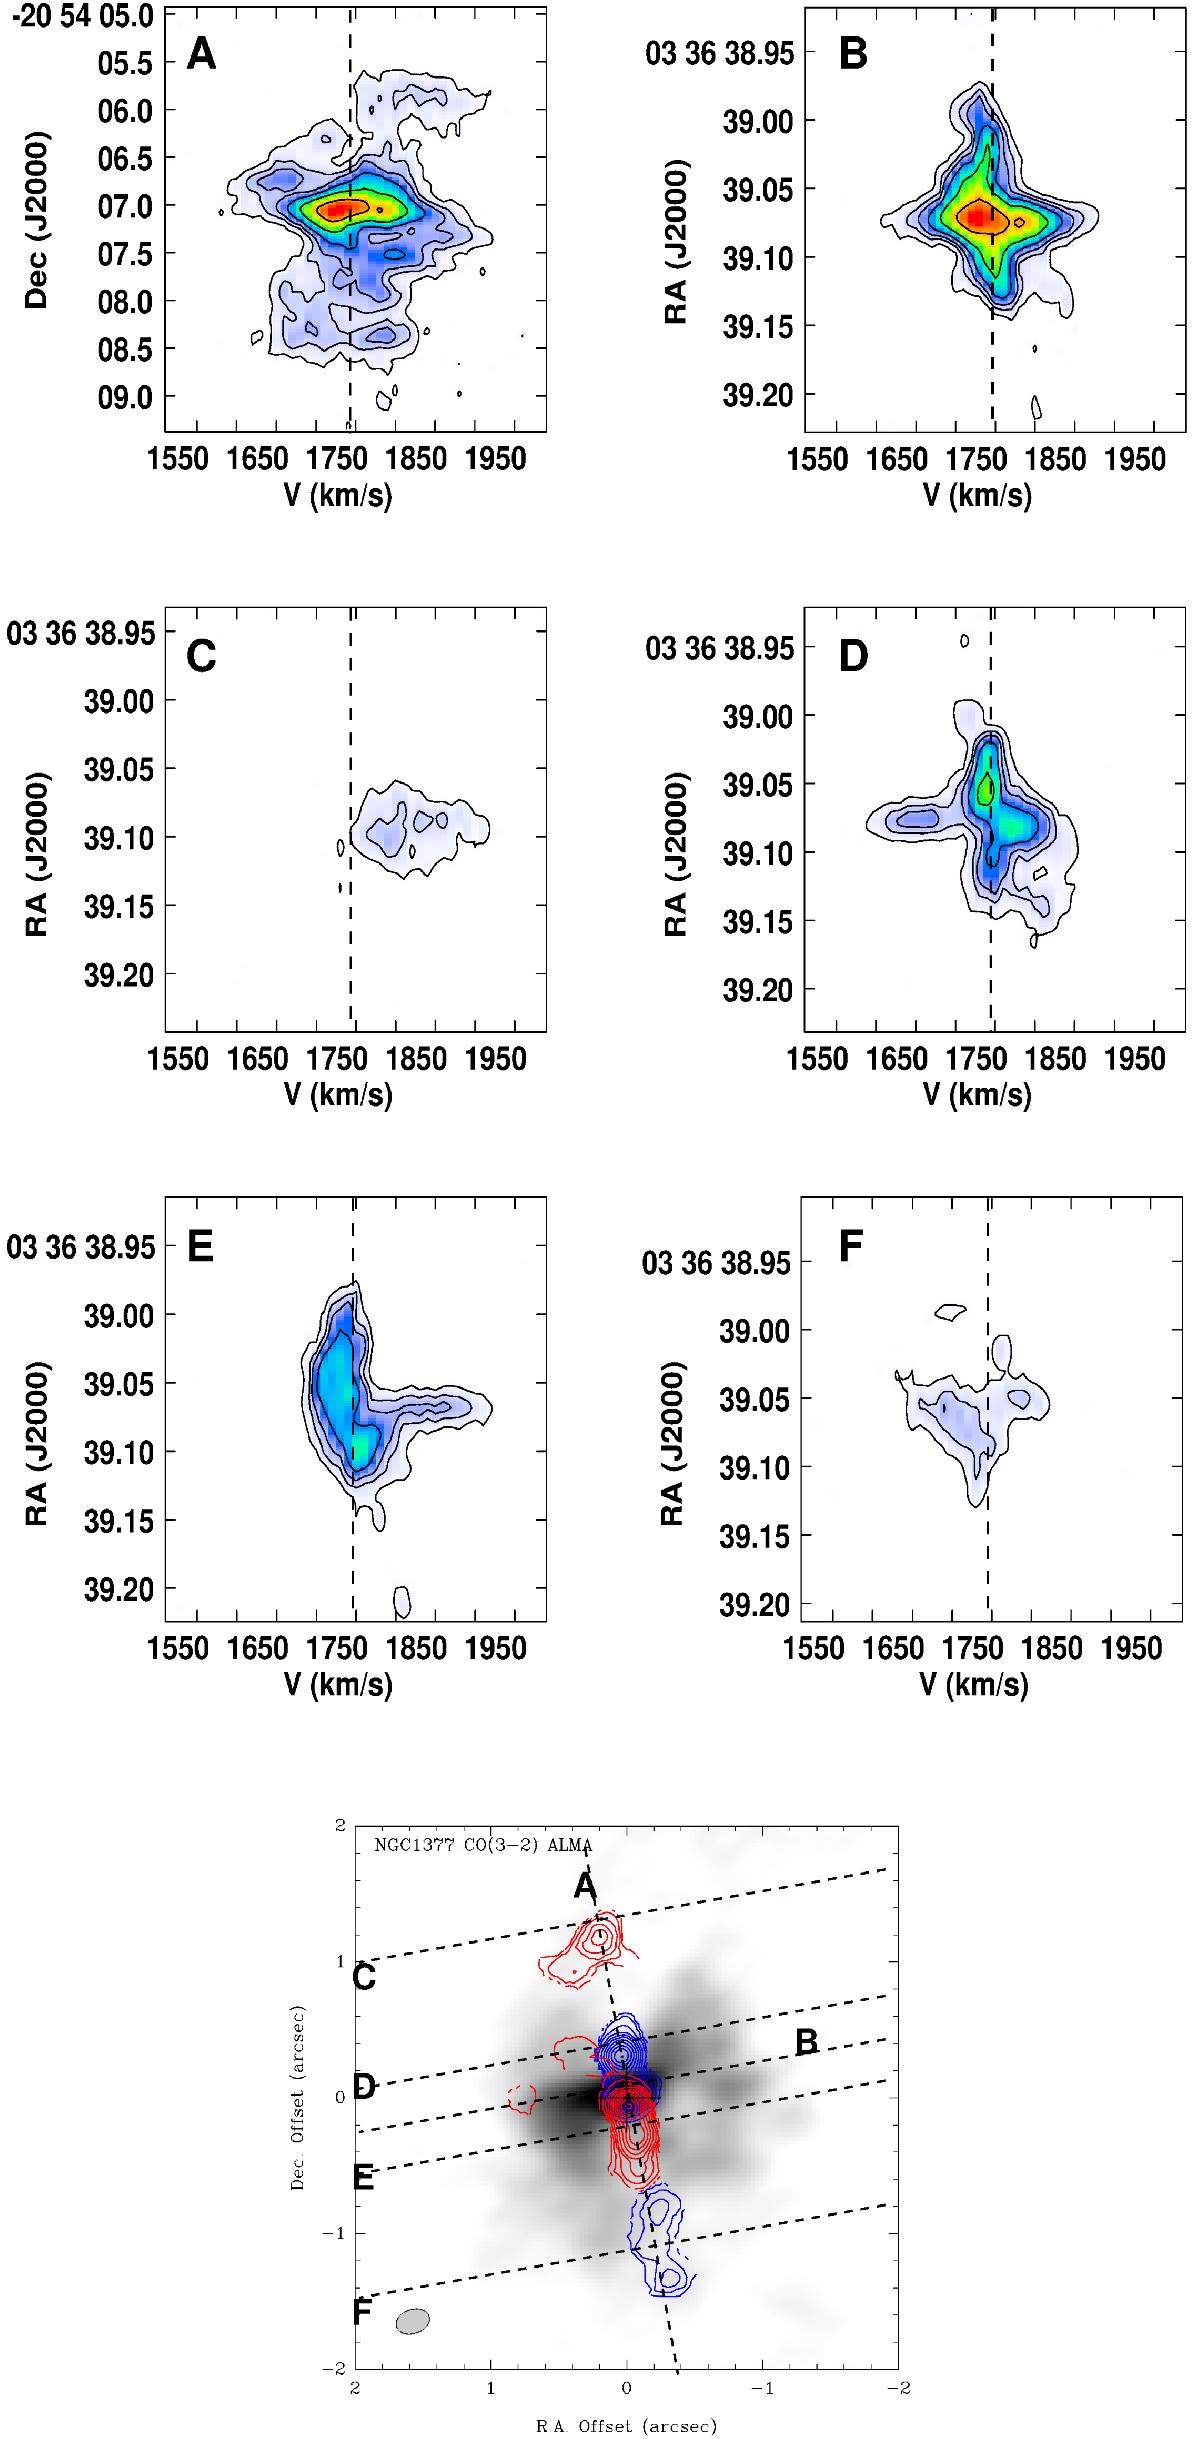
Position-velocity (PV) diagrams showing gas velocities in six different slits: A) along the jet axis; B) perpendicular to the jet axis through the nucleus; C) perpendicular to the jet axis at 1.̋2 to the north; D) perpendicular to the jet axis at 0.̋25 to the north; E) perpendicular to the jet axis at 0.̋25 to the south; F) perpendicular to the jet axis at 1.̋2 to the south. Contour levels are 3.1 × (1, 3, 5, 9, 18, 36) mJy beam-1 thus the first level is at 4σ. The colour scale range from 2 to 156 mJy beam-1.
Current usage metrics show cumulative count of Article Views (full-text article views including HTML views, PDF and ePub downloads, according to the available data) and Abstracts Views on Vision4Press platform.
Data correspond to usage on the plateform after 2015. The current usage metrics is available 48-96 hours after online publication and is updated daily on week days.
Initial download of the metrics may take a while.