Fig. 2
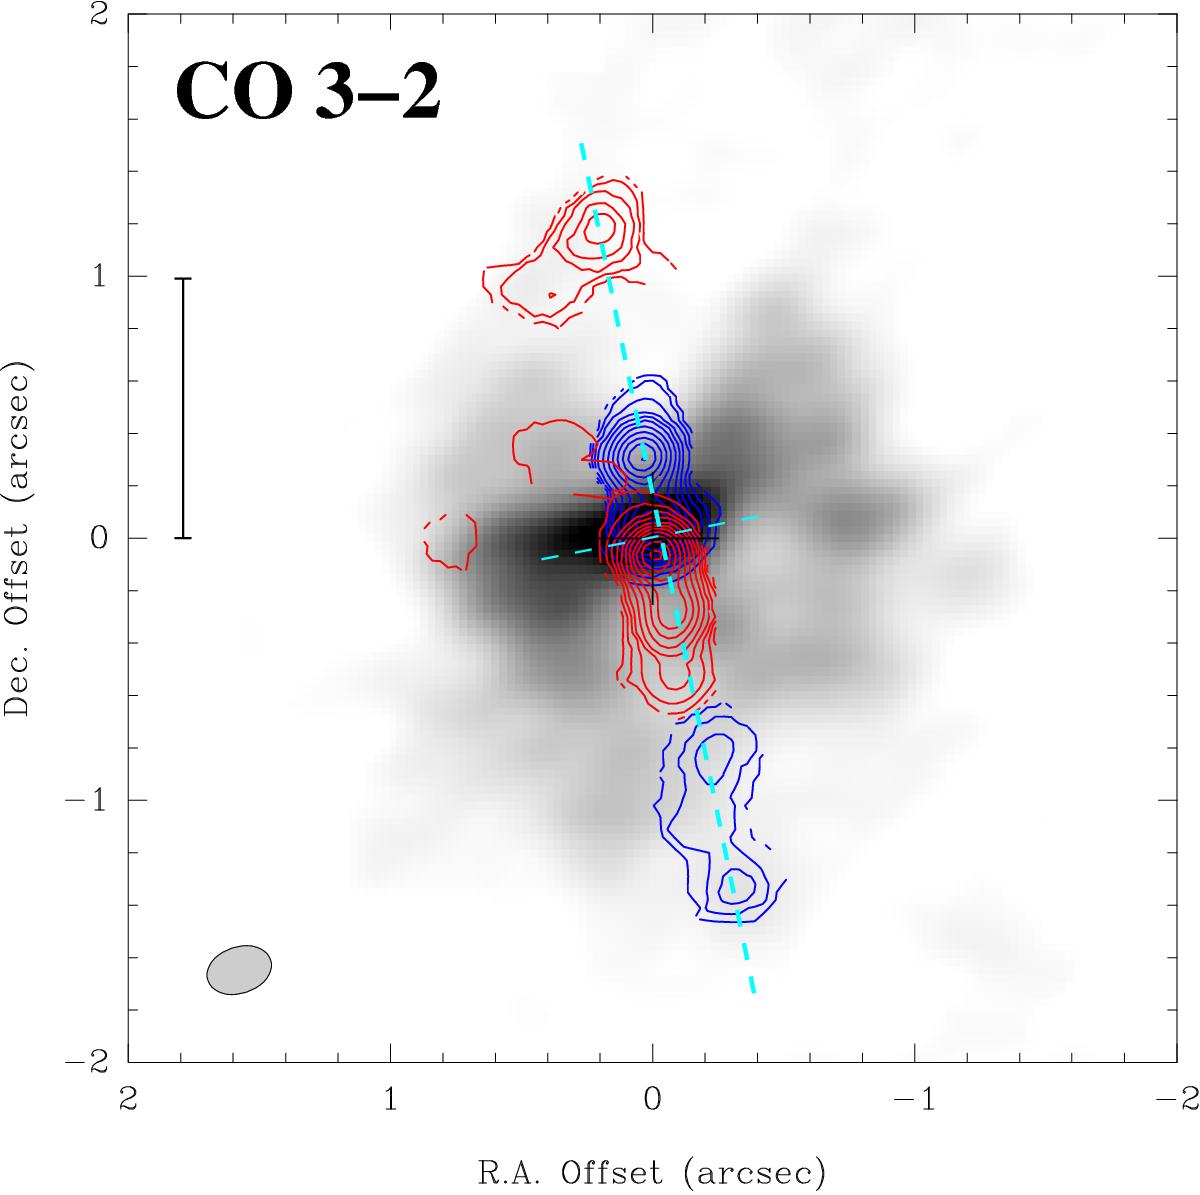
CO 3−2 integrated intensity image where emission close to systemic velocity (1700−1760 km s-1) is shown in greyscale (ranging from 0 to 70 Jy km s-1). The high velocity (±80 to ±150 km s-1) emission from the molecular jet is shown in contours (with the red and blue showing the velocity reversals). The contour levels are 1.0 × (1, 2, 3, 4, 5, 6, 7, 8, 9) Jy km s-1 beam-1. The dashed lines indicate the jet axis and the inferred orientation of the nuclear disk. The CO 3−2 beam is shown as a grey ellipse in the bottom left corner. The vertical bar indicates a scale of 100 pc.
Current usage metrics show cumulative count of Article Views (full-text article views including HTML views, PDF and ePub downloads, according to the available data) and Abstracts Views on Vision4Press platform.
Data correspond to usage on the plateform after 2015. The current usage metrics is available 48-96 hours after online publication and is updated daily on week days.
Initial download of the metrics may take a while.