Fig. B.3
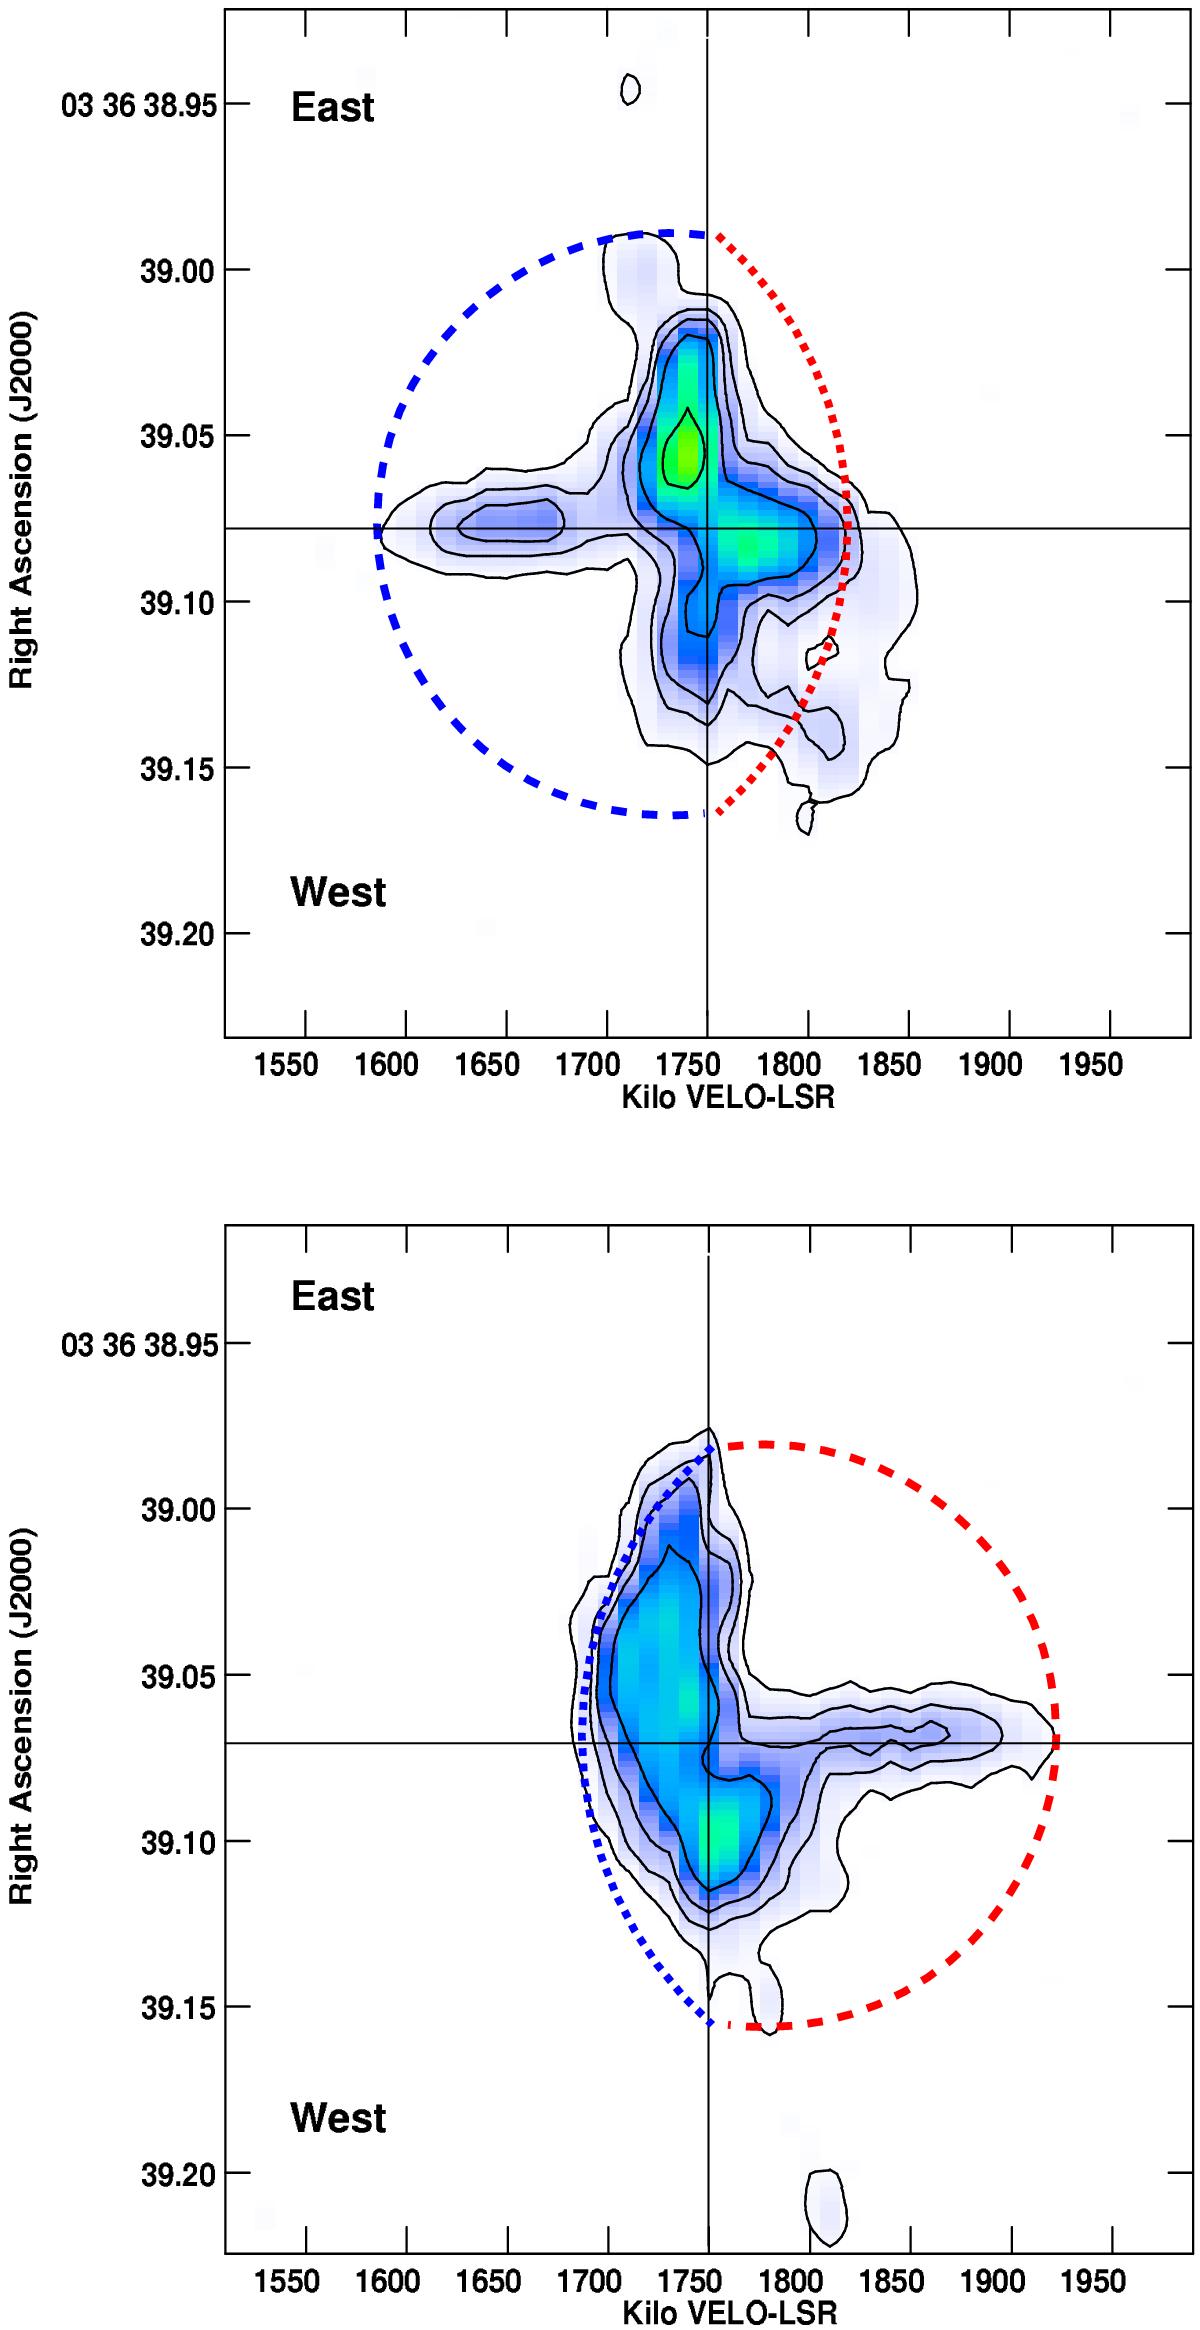
PV diagram, showing gas velocities in a slit across the jet axis at ±0.̋3. Contour levels are 3.1 × (1,2,4,8,16,32) mJy beam-1. The colour scale ranges from − 11 to 156 mJy beam-1. The dashed semi-ellipticals show the PV diagram expected from a projected wide-angle cone It is clear that this model does not fit the data.
Current usage metrics show cumulative count of Article Views (full-text article views including HTML views, PDF and ePub downloads, according to the available data) and Abstracts Views on Vision4Press platform.
Data correspond to usage on the plateform after 2015. The current usage metrics is available 48-96 hours after online publication and is updated daily on week days.
Initial download of the metrics may take a while.