Fig. B.1
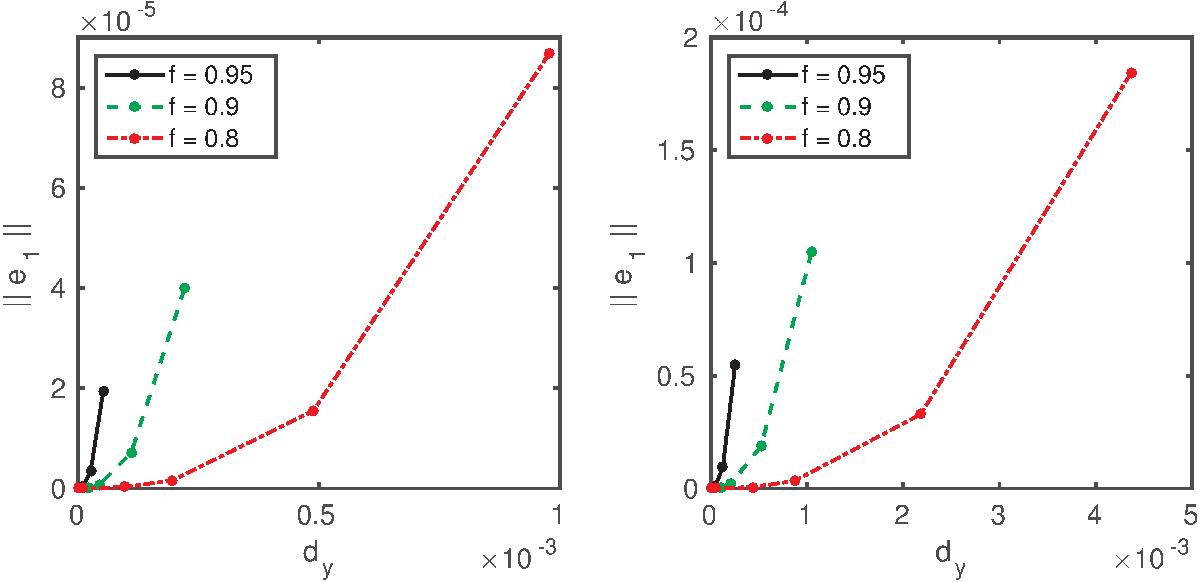
Dependence of the errors due to leading-order Taylor approximation of the potential ratios on the distance to the fold singularity as defined in Eq. (B.1) for the representative examples of an SIE (left) and an SIEP (right) for the parameter values a = 1 and f = 0.95 (black solid line), f = 0.9 (green dashed line), and f = 0.8 (red dash-dotted line).
Current usage metrics show cumulative count of Article Views (full-text article views including HTML views, PDF and ePub downloads, according to the available data) and Abstracts Views on Vision4Press platform.
Data correspond to usage on the plateform after 2015. The current usage metrics is available 48-96 hours after online publication and is updated daily on week days.
Initial download of the metrics may take a while.