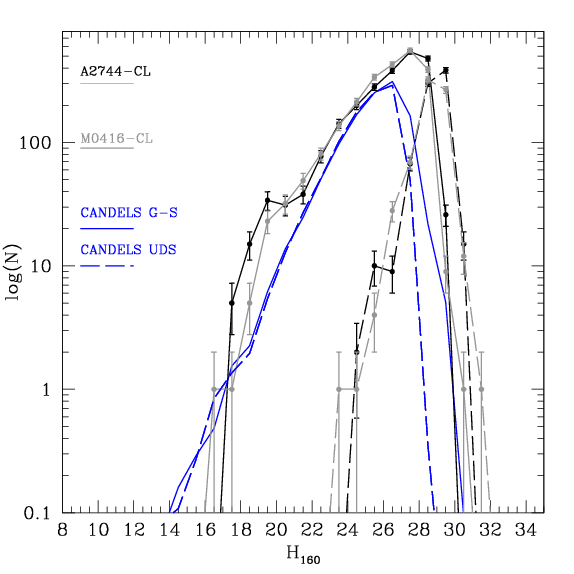
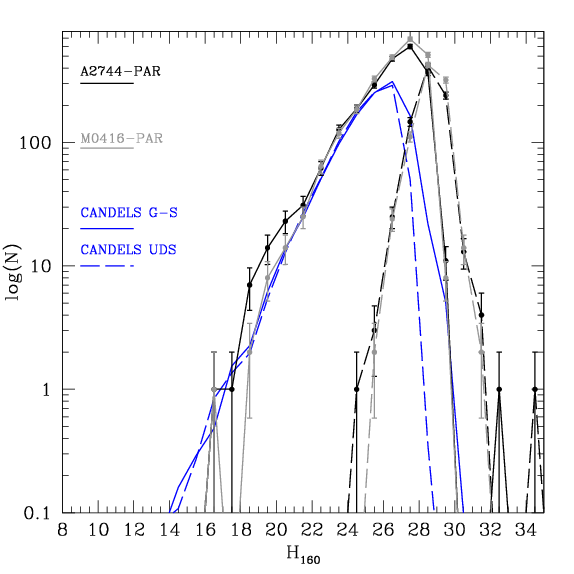
Fig. 9
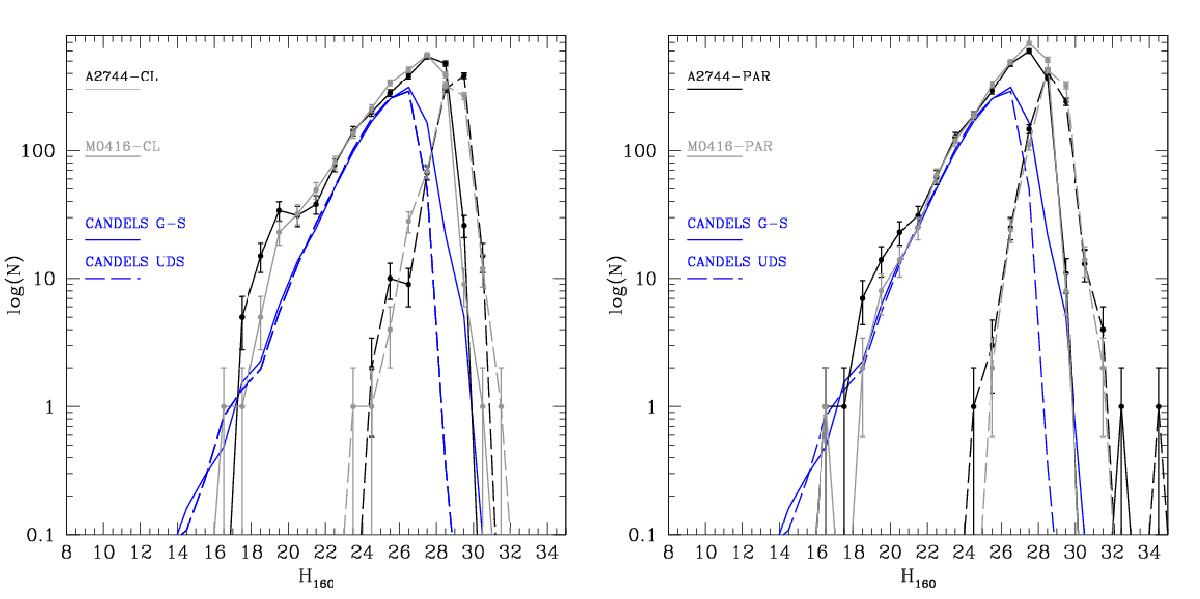
Raw number counts of detected objects in the detection images. Top panel: A2744; bottom panel: M0416. Black lines refer to the cluster fields, blue lines to the parallel fields; solid lines refer to the H-detected catalogue; dashed lines: the additional IR-stack detected catalogue. For reference, the red lines refer to CANDELS fields number counts re-scaled to the FF area (solid: GOODS-South, dashed: UDS). See text for details.
Current usage metrics show cumulative count of Article Views (full-text article views including HTML views, PDF and ePub downloads, according to the available data) and Abstracts Views on Vision4Press platform.
Data correspond to usage on the plateform after 2015. The current usage metrics is available 48-96 hours after online publication and is updated daily on week days.
Initial download of the metrics may take a while.