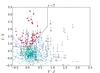
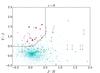
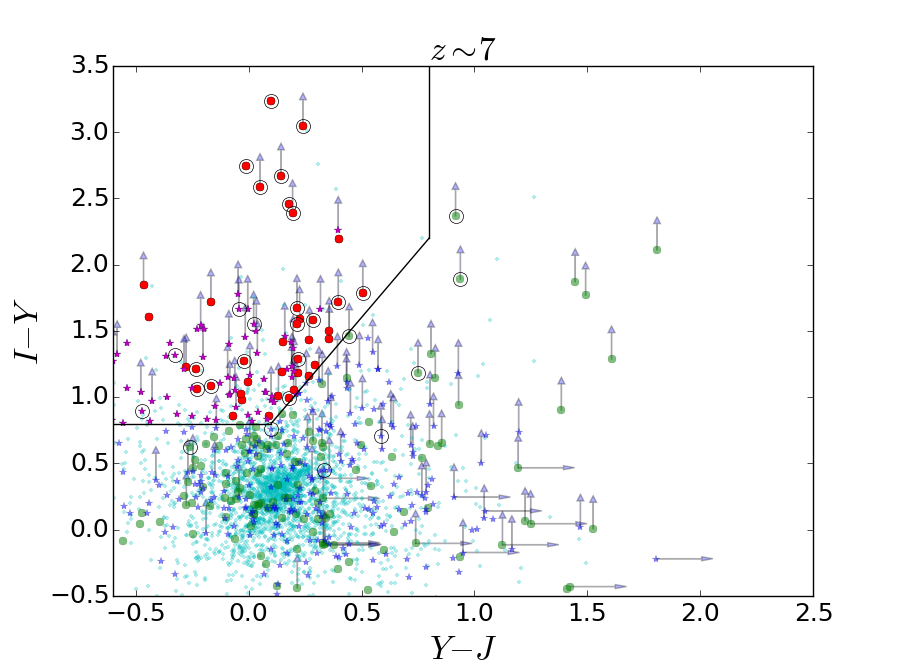
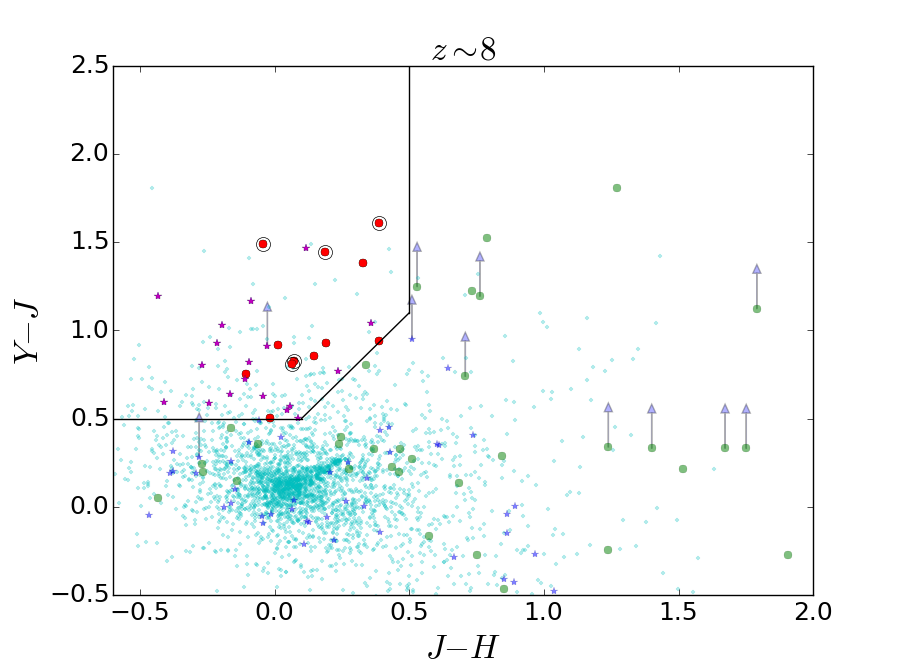
Fig. 13

Colour selection of high-redshift sources. Top panel: IYJ diagram for z ~ 7 candidates (cyan points: sources with 1σ detection in B435 or V606, which we exclude from the selection; green dots: H-detected sources, undetected in B435 and V606; blue stars: IR-detected sources, undetected in B435 and V606; red dots: H-detected z ~ 7 candidates; magenta stars: IR-detected z ~ 7 candidates; empty black circles: Atek et al. (2015)z ~ 7 candidates; arrows represent upper limits). Bottom panel: YJH diagram for z ~ 8 candidates (symbols have the same meaning as in the top panel, except that the cyan points represent sources that we exclude from the selection because they are detected in B435, in V606, or in I814).
Current usage metrics show cumulative count of Article Views (full-text article views including HTML views, PDF and ePub downloads, according to the available data) and Abstracts Views on Vision4Press platform.
Data correspond to usage on the plateform after 2015. The current usage metrics is available 48-96 hours after online publication and is updated daily on week days.
Initial download of the metrics may take a while.