Fig. 8
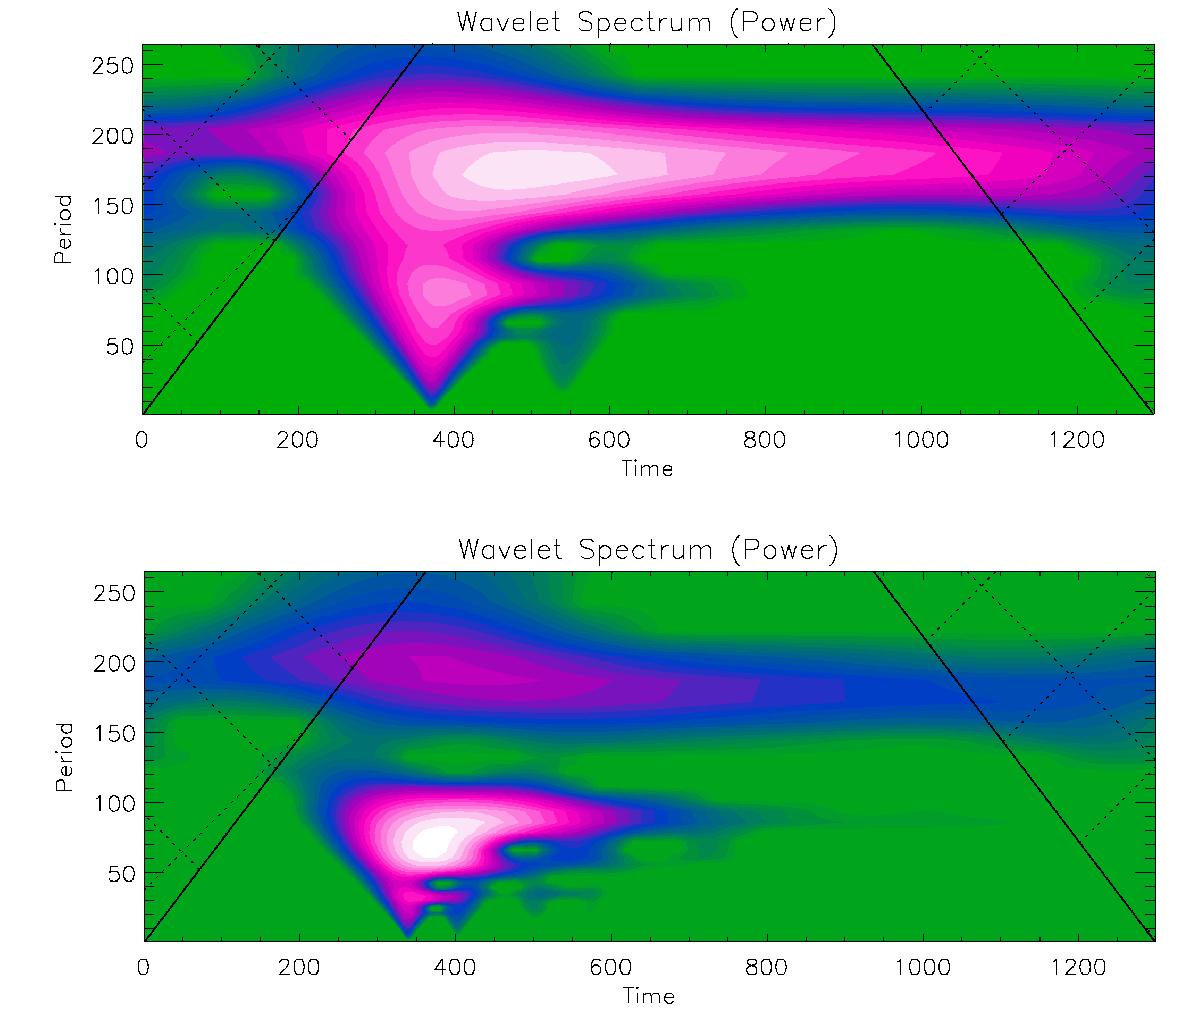
Wavelet spectrum of the pressure variation at detection point 9 (top of the loop; upper part), and at detection point 4 (bottom part), symmetric case (Run I). For the periods, see the pink areas. The period and time are in seconds. The hatched regions belong to the cone of influence by edge effects owing to finite-length time series.
Current usage metrics show cumulative count of Article Views (full-text article views including HTML views, PDF and ePub downloads, according to the available data) and Abstracts Views on Vision4Press platform.
Data correspond to usage on the plateform after 2015. The current usage metrics is available 48-96 hours after online publication and is updated daily on week days.
Initial download of the metrics may take a while.