Fig. 5
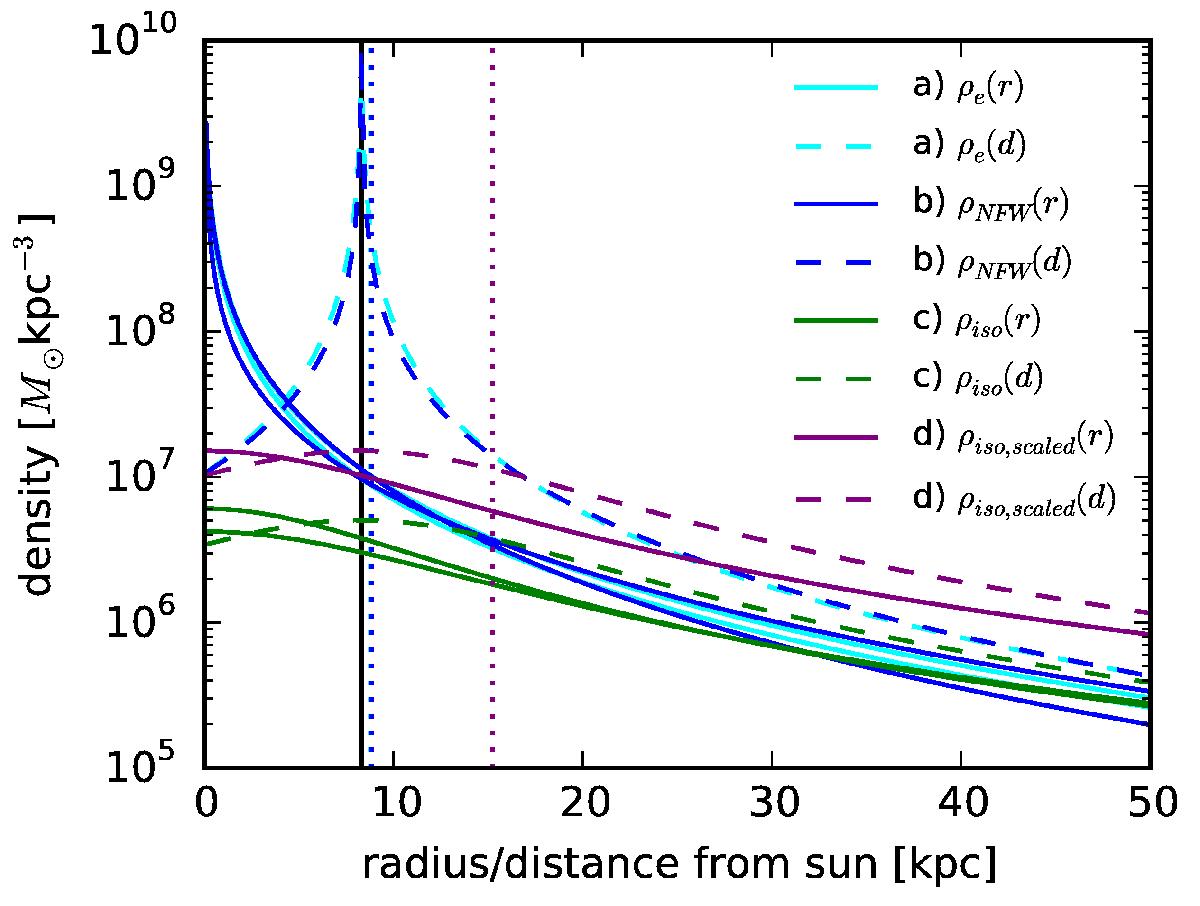
A selection of density profiles and parameter ranges fromTable 4 as a function of radius from the galactic centre (solid line) and along the line of sight towards Sgr A* (dashed line). The vertical black line indicates the solar radius, and the dotted vertical lines are the mass-weighted average distances for each of the profiles.
Current usage metrics show cumulative count of Article Views (full-text article views including HTML views, PDF and ePub downloads, according to the available data) and Abstracts Views on Vision4Press platform.
Data correspond to usage on the plateform after 2015. The current usage metrics is available 48-96 hours after online publication and is updated daily on week days.
Initial download of the metrics may take a while.