Fig. 4
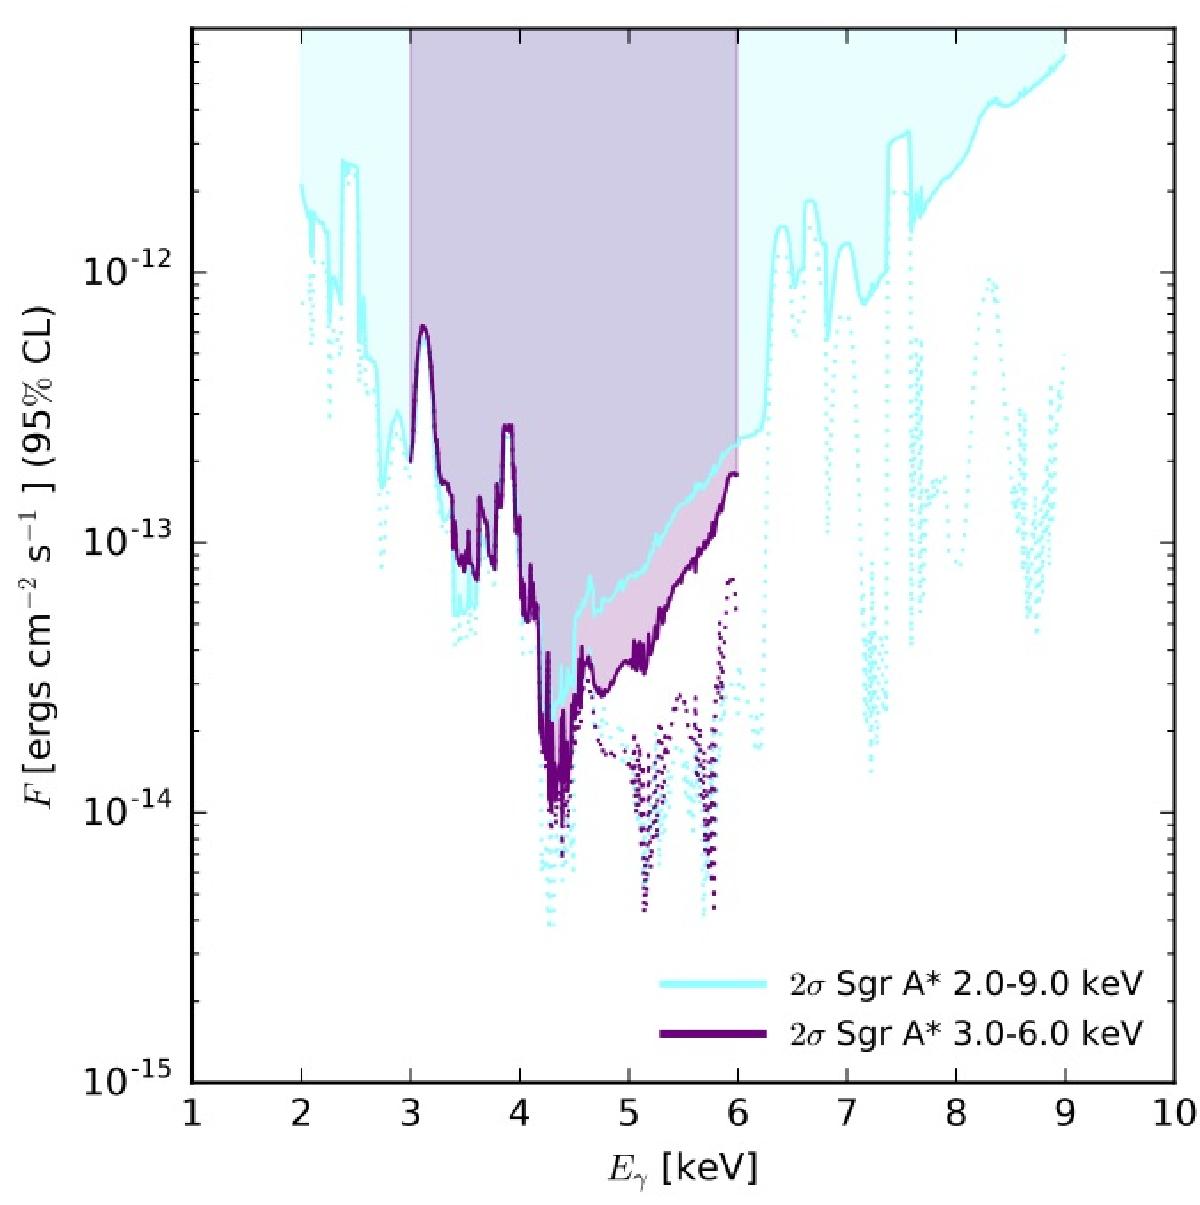
Constraints on line emission flux in the stacked spectrum (95% confidence). The cyan lines represent the entire 2–9 keV interval model, and purple lines the 3–6 keV interval. Solid lines represent the total flux in line emission (including instrumental and astrophysical lines) and for dotted lines the broad instrumental lines have been subtracted.
Current usage metrics show cumulative count of Article Views (full-text article views including HTML views, PDF and ePub downloads, according to the available data) and Abstracts Views on Vision4Press platform.
Data correspond to usage on the plateform after 2015. The current usage metrics is available 48-96 hours after online publication and is updated daily on week days.
Initial download of the metrics may take a while.