Free Access
Fig. 1
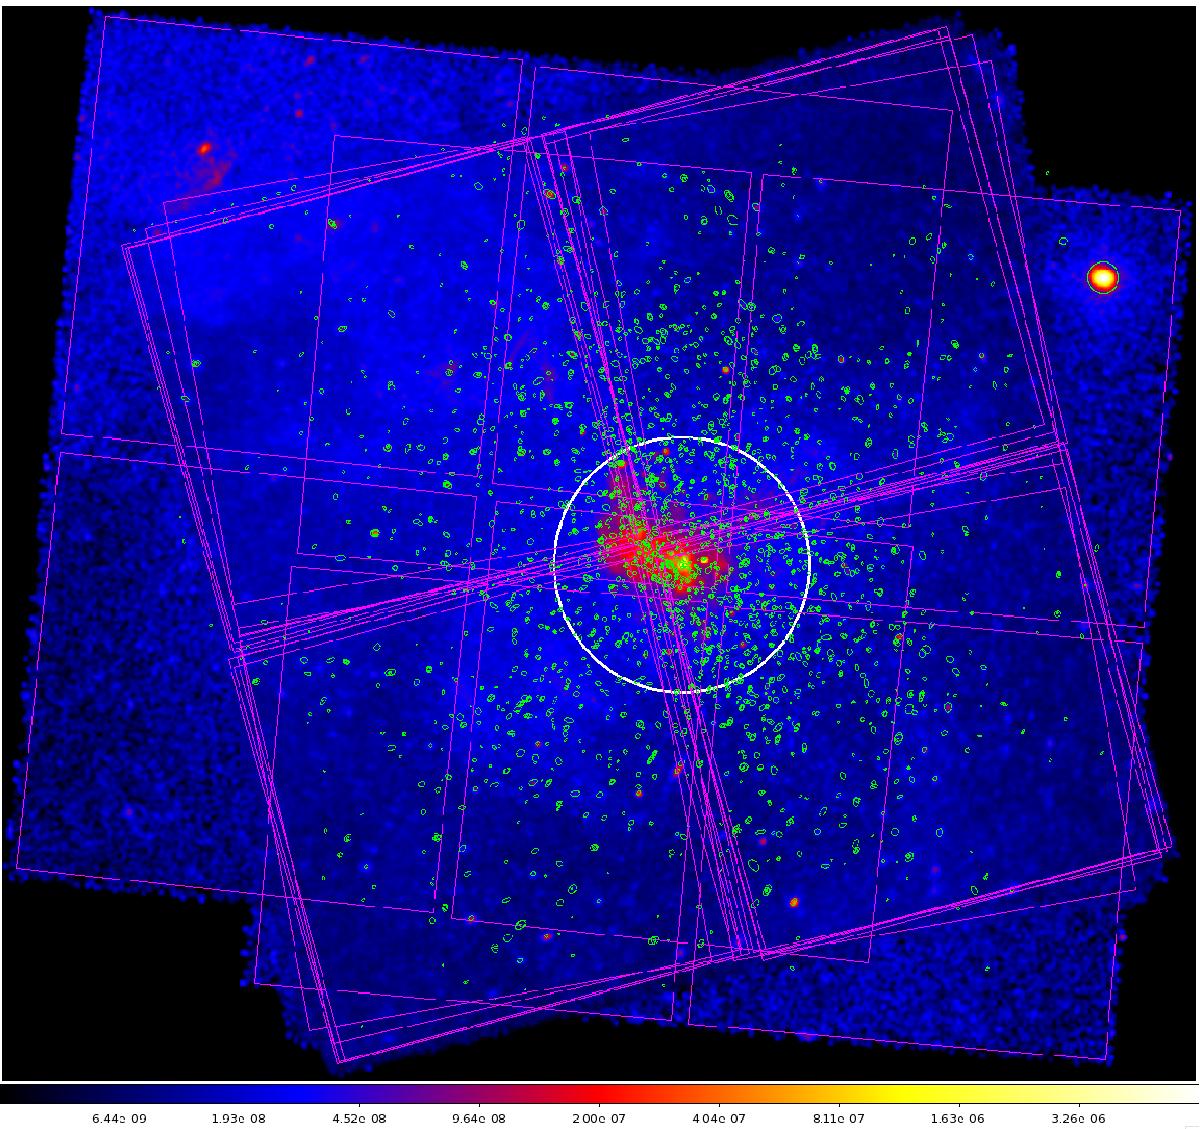
Fluxed image of the observations inTable 1 showing the positions of each 8′ × 8′ chip for each observation (magenta squares) and the regions removed as point sources (small green ellipses, <1% of the total area) and Sgr A (white circle). The data have been smoothed with a five-pixel Gaussian for visualisation purposes.
Current usage metrics show cumulative count of Article Views (full-text article views including HTML views, PDF and ePub downloads, according to the available data) and Abstracts Views on Vision4Press platform.
Data correspond to usage on the plateform after 2015. The current usage metrics is available 48-96 hours after online publication and is updated daily on week days.
Initial download of the metrics may take a while.