Fig. 5
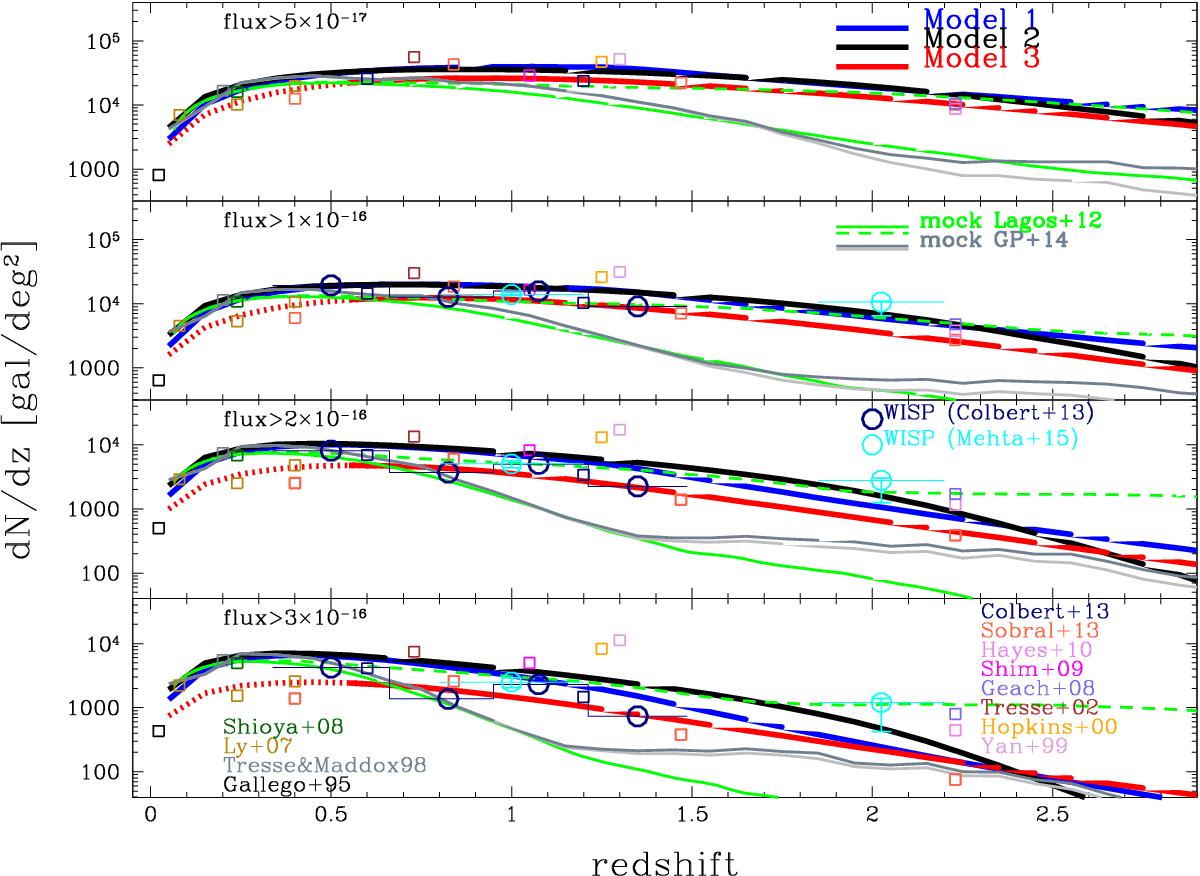
Hα redshift distribution above various flux thresholds (from 0.5 × 10⁻¹⁶ erg cm-2 s-1 to 3 × 10-16 erg cm-2 s-1, from top to bottom panels). Observed redshift distributions are indicated with open circles, while data obtained integrating LFs are shown with squares. HaLF predictions from Model 1, 2, 3 are shown as thick solid lines. The predictions from L12 mocks (green dashed and solid lines using intrinsic and extincted Hα fluxes, respectively) and GP14 mocks (dark and light grey for H< 27 and H< 24 mocks, respectively) are also shown.
Current usage metrics show cumulative count of Article Views (full-text article views including HTML views, PDF and ePub downloads, according to the available data) and Abstracts Views on Vision4Press platform.
Data correspond to usage on the plateform after 2015. The current usage metrics is available 48-96 hours after online publication and is updated daily on week days.
Initial download of the metrics may take a while.