Fig. C.1
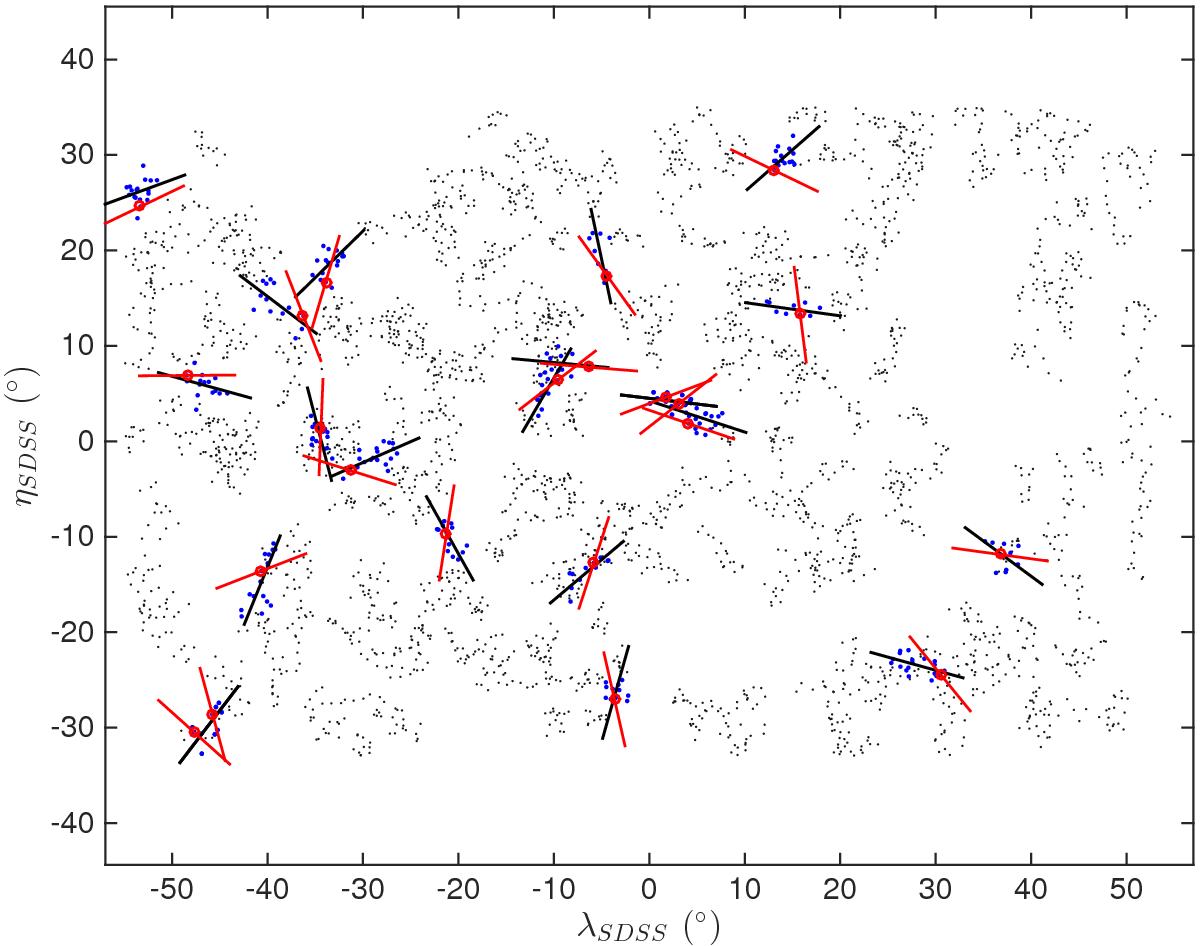
Projection on the sky, in SDSS coordinates, of the LQGs with a richness in the range 10–19 (clouds of grey dots). The LQGs containing at least one quasar with polarization measurements (circled in red) are highlighted in blue. The black lines trace the orientation of the projected major axes of the groups (here at the centres of masses). The red lines give the orientations of the polarization vectors. All lines are of equal lengths for clarity. The polarization vectors are preferentially parallel to the projected major axes of the groups.
Current usage metrics show cumulative count of Article Views (full-text article views including HTML views, PDF and ePub downloads, according to the available data) and Abstracts Views on Vision4Press platform.
Data correspond to usage on the plateform after 2015. The current usage metrics is available 48-96 hours after online publication and is updated daily on week days.
Initial download of the metrics may take a while.