Fig. B.1
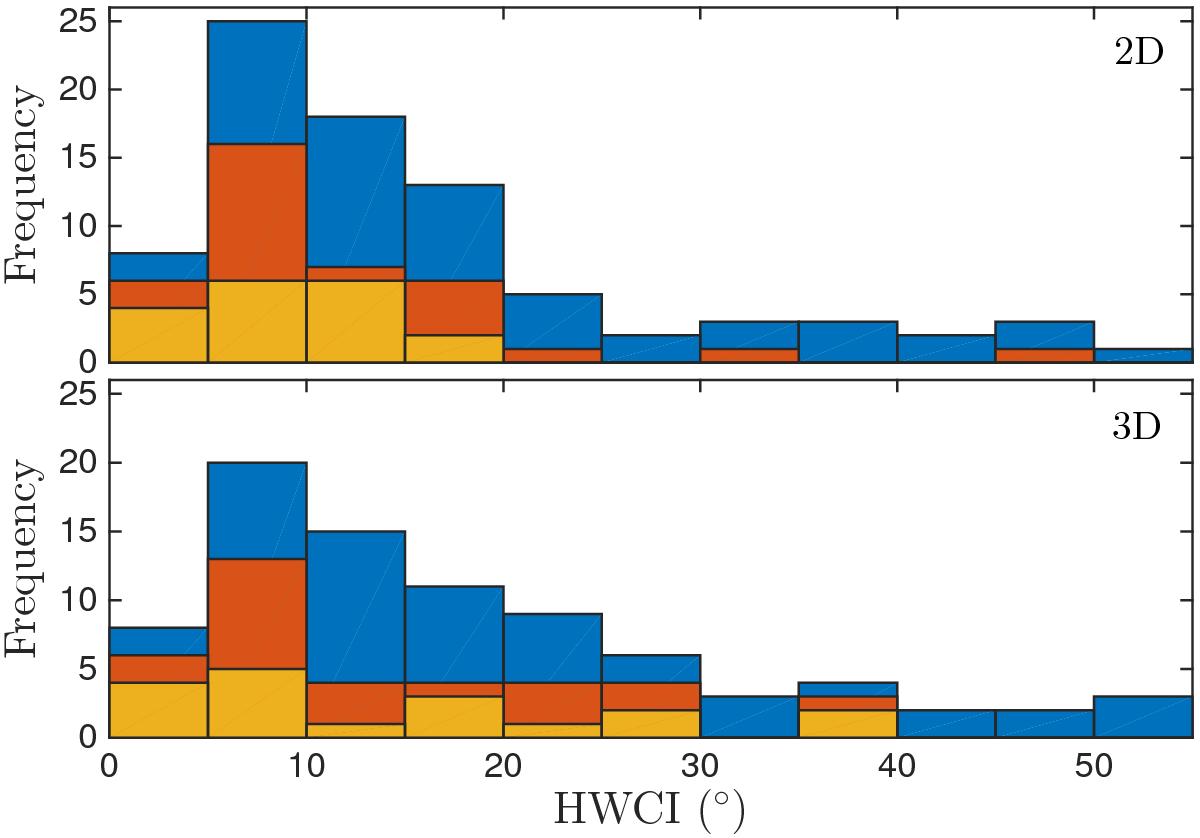
Histograms of the half-width confidence interval (HWCI) for the MPA values obtained for the 83 independent LQGs with the two- (top) and three-dimensional (bottom) approaches (see Sect. 3). The HWCIs are evaluated using the bootstrap method as explained in the text. Histograms are for m ≥ 5 (blue), m ≥ 10 (orange), and m ≥ 20 (yellow).
Current usage metrics show cumulative count of Article Views (full-text article views including HTML views, PDF and ePub downloads, according to the available data) and Abstracts Views on Vision4Press platform.
Data correspond to usage on the plateform after 2015. The current usage metrics is available 48-96 hours after online publication and is updated daily on week days.
Initial download of the metrics may take a while.