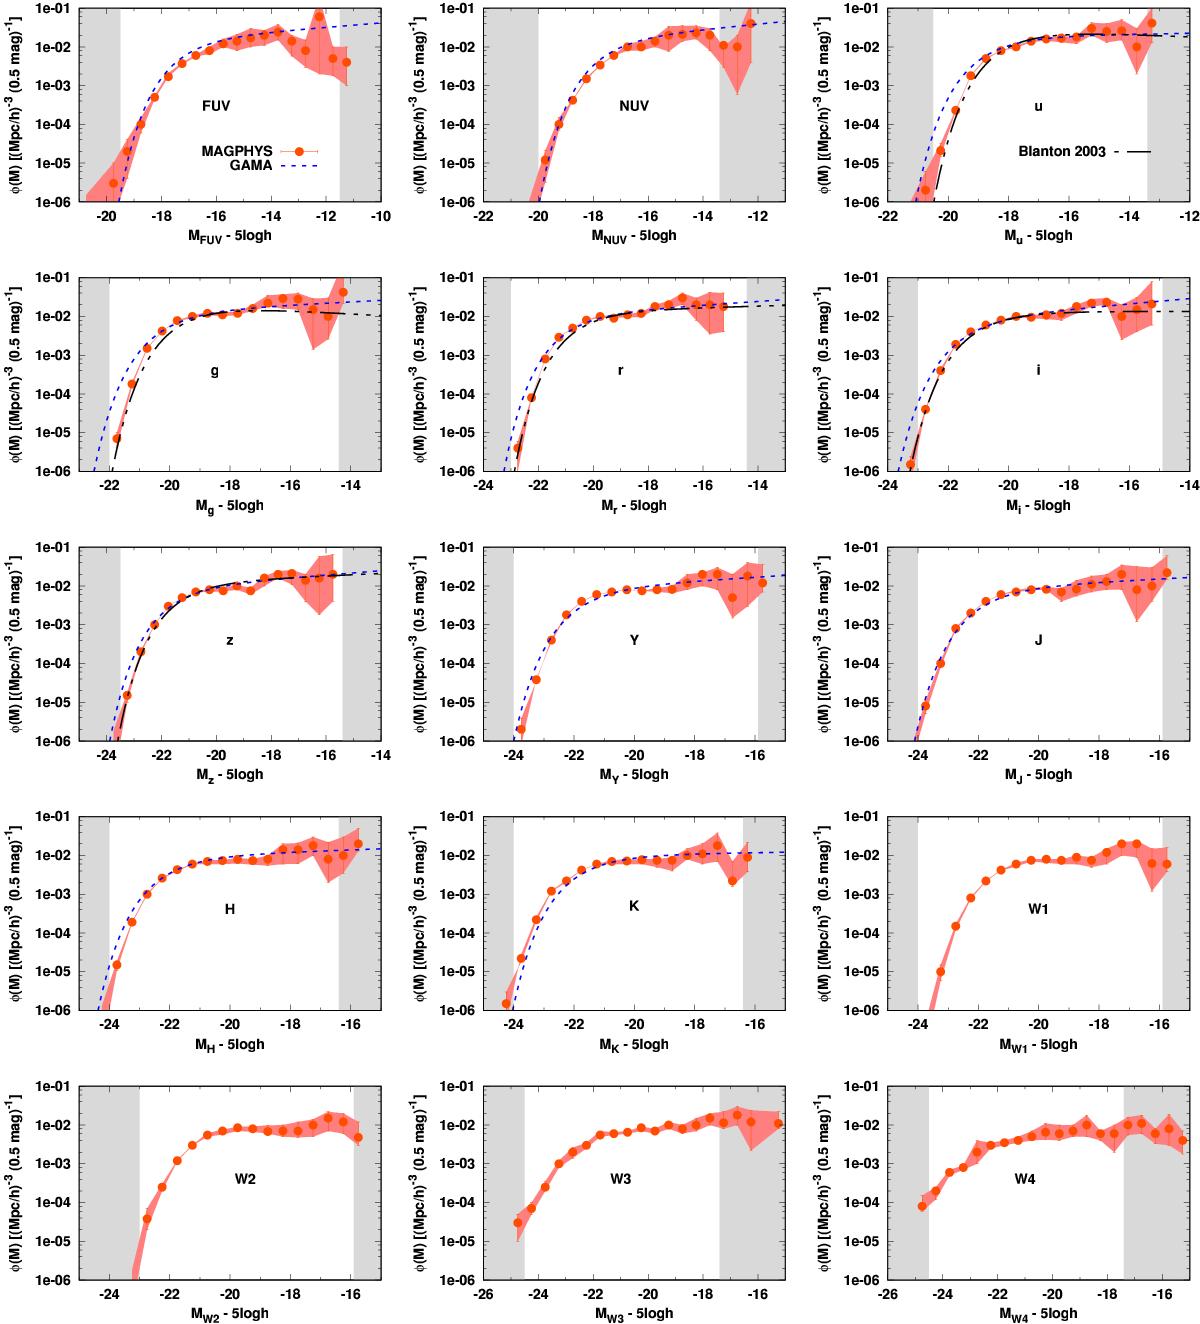
Fig. A.1

Luminosity functions of galaxies in FUV, NUV, u, g, r, i, z, Y, J, H, K, W1, W2, W3, and W4 bands as indicated. The gray shaded region shows the selection boundaries explained in Sect. 4.2. The red points correspond to 1 /Vmax corrected number densities in each absolute magnitude bin and the red shaded region shows the error limits. The blue dashed line shows GAMA luminosity functions and black dot-dashed line shows luminosity functions from Blanton et al. (2003). Both GAMA and Blanton et al. (2003) estimate luminosity functions for galaxies up to redshift 0.1. Red points with error bars represent our estimates using 1 /Vmax method in the redshift range 0.01–0.2.
Current usage metrics show cumulative count of Article Views (full-text article views including HTML views, PDF and ePub downloads, according to the available data) and Abstracts Views on Vision4Press platform.
Data correspond to usage on the plateform after 2015. The current usage metrics is available 48-96 hours after online publication and is updated daily on week days.
Initial download of the metrics may take a while.


