Fig. 6
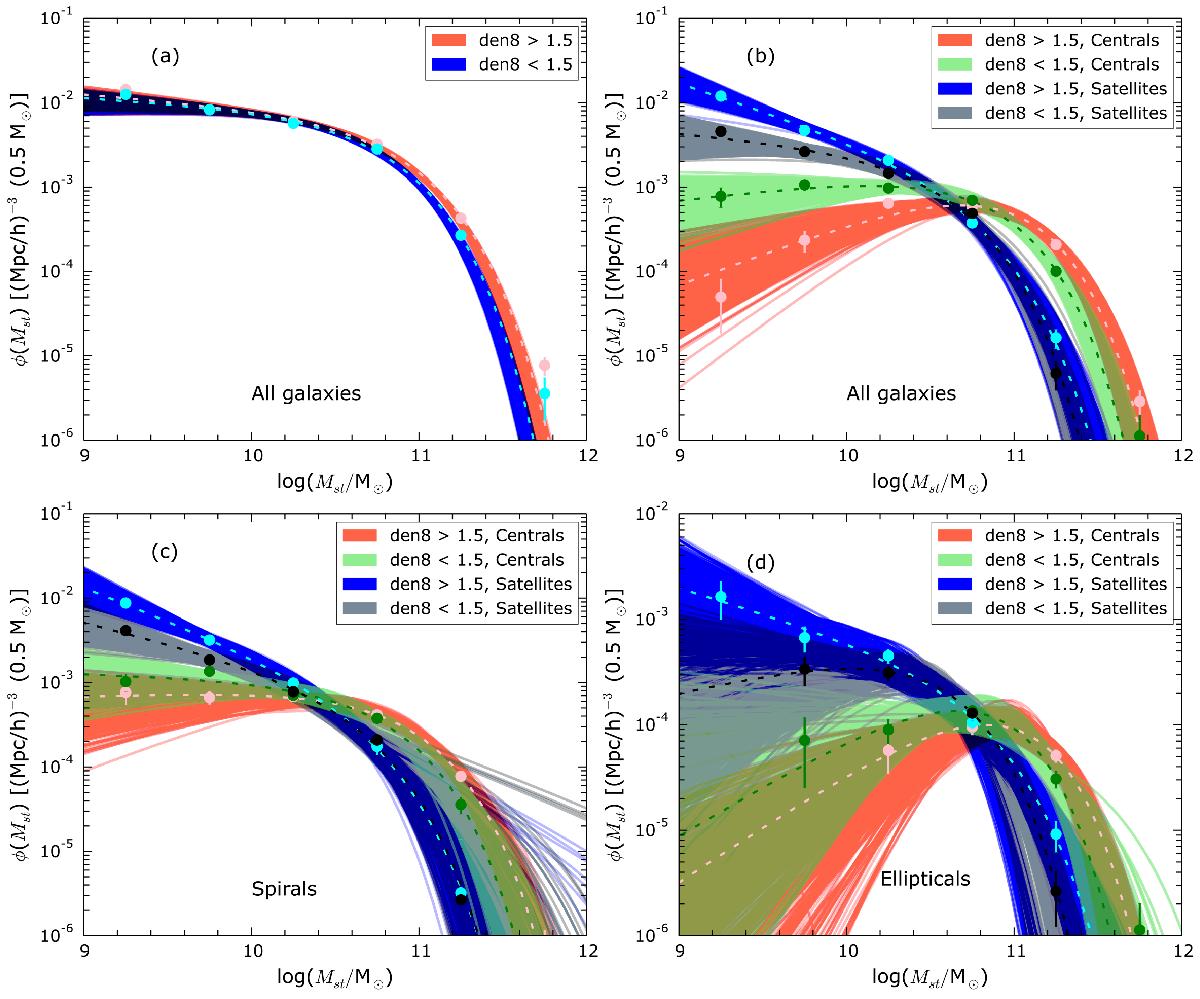
a) Stellar mass function of galaxies in high- (light red points) and low- (sky blue points) density large scale environments. The light red and sky blue dashed lines represent the best single Schechter function fits of galaxies in high- and low-density environments, respectively. The red and blue solid lines, which form red and blue shaded regions, show individual single Schechter function fits to the galaxy stellar mass functions obtained from all bootstrap samples of galaxies in high- and low-density environments, respectively. b) Stellar mass function of central and satellite galaxies in high- and low-density, large-scale environments. The light red (sky blue) and dark green (black) dashed lines represent the best single Schechter function fits of central (satellite) galaxies in high- and low-density environments, respectively. The red (blue) and light green (gray) solid lines which form red (blue) and light green (gray) shaded regions show individual single Schechter function fits to the central (satellite) galaxy stellar mass functions obtained from all bootstrap samples in high- and low-density, large-scale environments, respectively. c) Same as b) but for galaxies with spiral morphologies. d) Same as b) but for galaxies with elliptical morphologies. In all of the plots, the points and error bars represent the mean densities and error in densities calculated using the bootstrap resampling technique.
Current usage metrics show cumulative count of Article Views (full-text article views including HTML views, PDF and ePub downloads, according to the available data) and Abstracts Views on Vision4Press platform.
Data correspond to usage on the plateform after 2015. The current usage metrics is available 48-96 hours after online publication and is updated daily on week days.
Initial download of the metrics may take a while.