Fig. 5
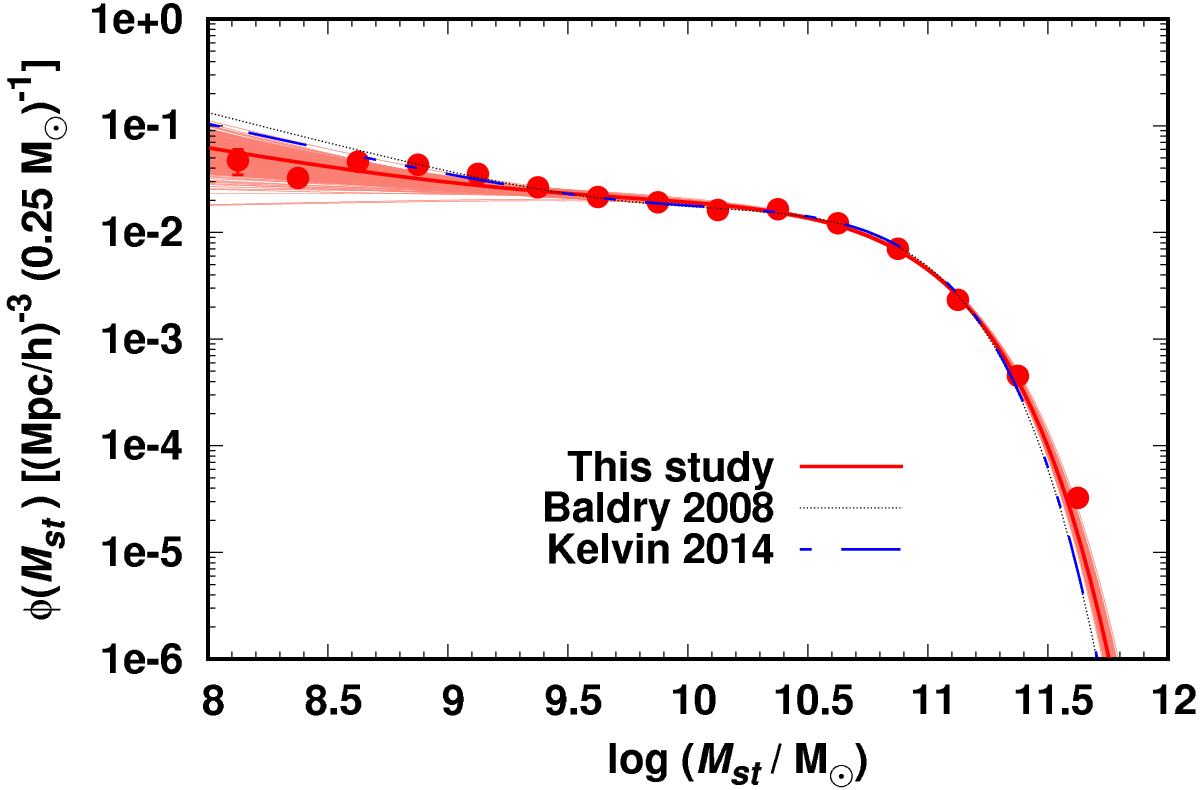
Stellar mass function of galaxies obtained from SED fitting and comparison with Baldry et al. (2008; black dotted line) and Kelvin et al. (2014; blue dashed line) results. The red solid line represents the best double Schechter function fit. The light red lines, which form a shaded region, represent the individual double Schechter function fits to the galaxy stellar mass functions obtained from all bootstrap samples. The errors in density estimates at each stellar mass bins are calculated using bootstrap resampling technique.
Current usage metrics show cumulative count of Article Views (full-text article views including HTML views, PDF and ePub downloads, according to the available data) and Abstracts Views on Vision4Press platform.
Data correspond to usage on the plateform after 2015. The current usage metrics is available 48-96 hours after online publication and is updated daily on week days.
Initial download of the metrics may take a while.