Free Access
Fig. 1
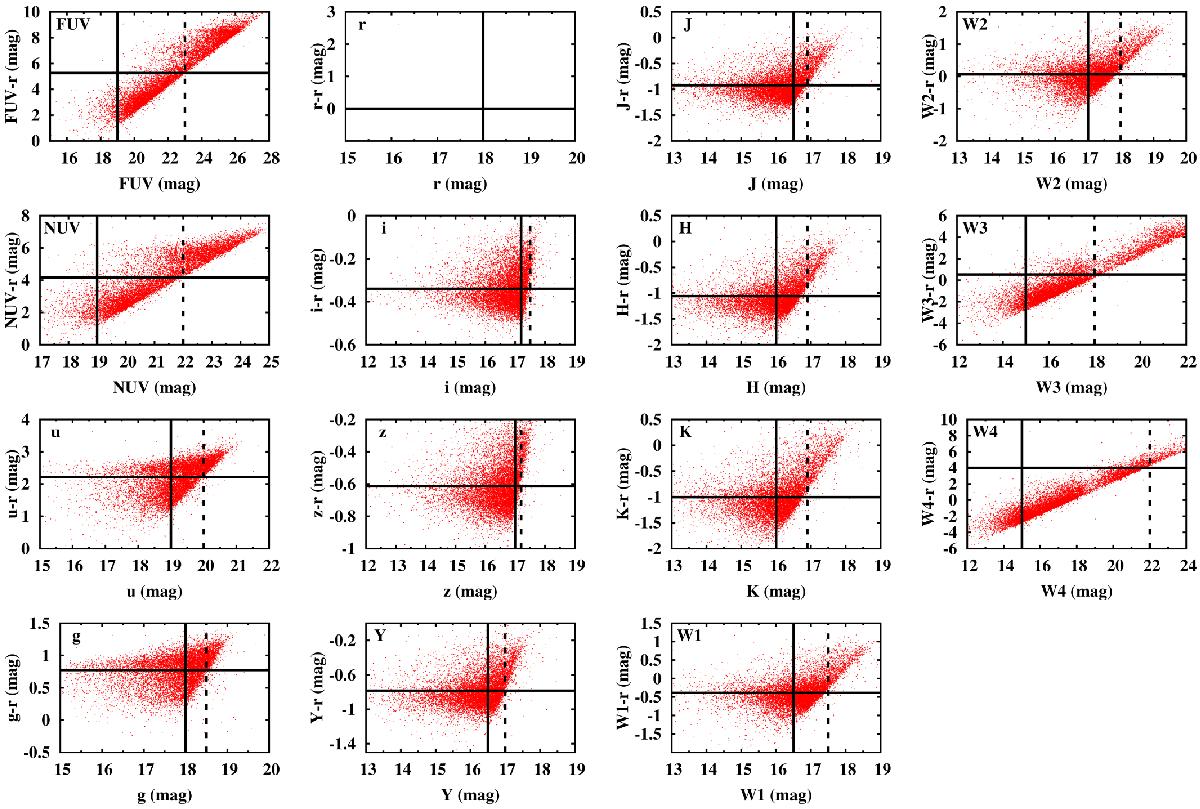
Color bias in the sample. The horizontal solid line shows the mean color in the indicated band. The dotted line shows the faint magnitude limit, while the vertical solid line shows the bright limit of the sample. The choice of the limits are based on visual inspection.
Current usage metrics show cumulative count of Article Views (full-text article views including HTML views, PDF and ePub downloads, according to the available data) and Abstracts Views on Vision4Press platform.
Data correspond to usage on the plateform after 2015. The current usage metrics is available 48-96 hours after online publication and is updated daily on week days.
Initial download of the metrics may take a while.