Free Access
Fig. 3
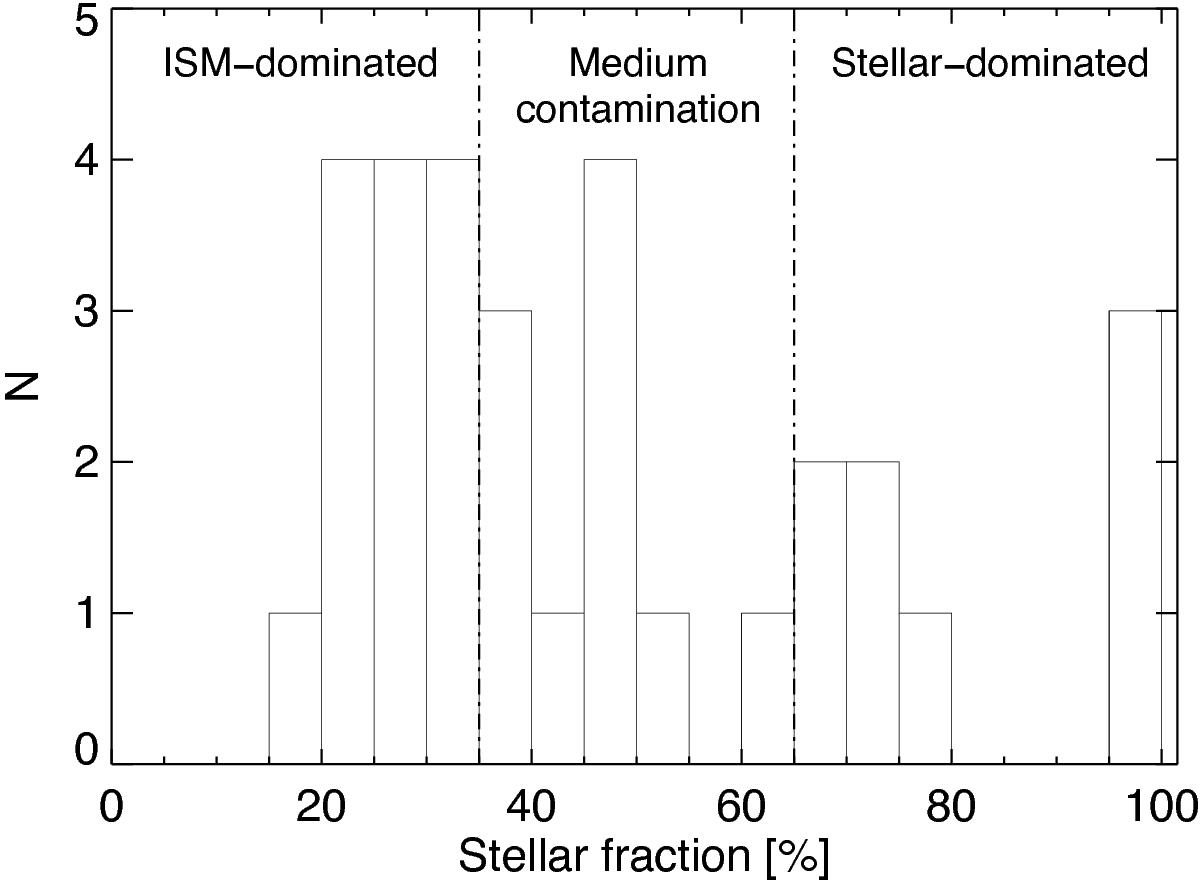
Distribution of the stellar contribution to the observed integrated NaD (Table 2) for the 31 objects with a good stellar continuum modeling (Sect. 3.1). Vertical lines follow the adopted definition for interstellar dominated, medium-contaminated, and stellar dominated objects; see Sect. 4.1 for details.
Current usage metrics show cumulative count of Article Views (full-text article views including HTML views, PDF and ePub downloads, according to the available data) and Abstracts Views on Vision4Press platform.
Data correspond to usage on the plateform after 2015. The current usage metrics is available 48-96 hours after online publication and is updated daily on week days.
Initial download of the metrics may take a while.