Fig. A.1
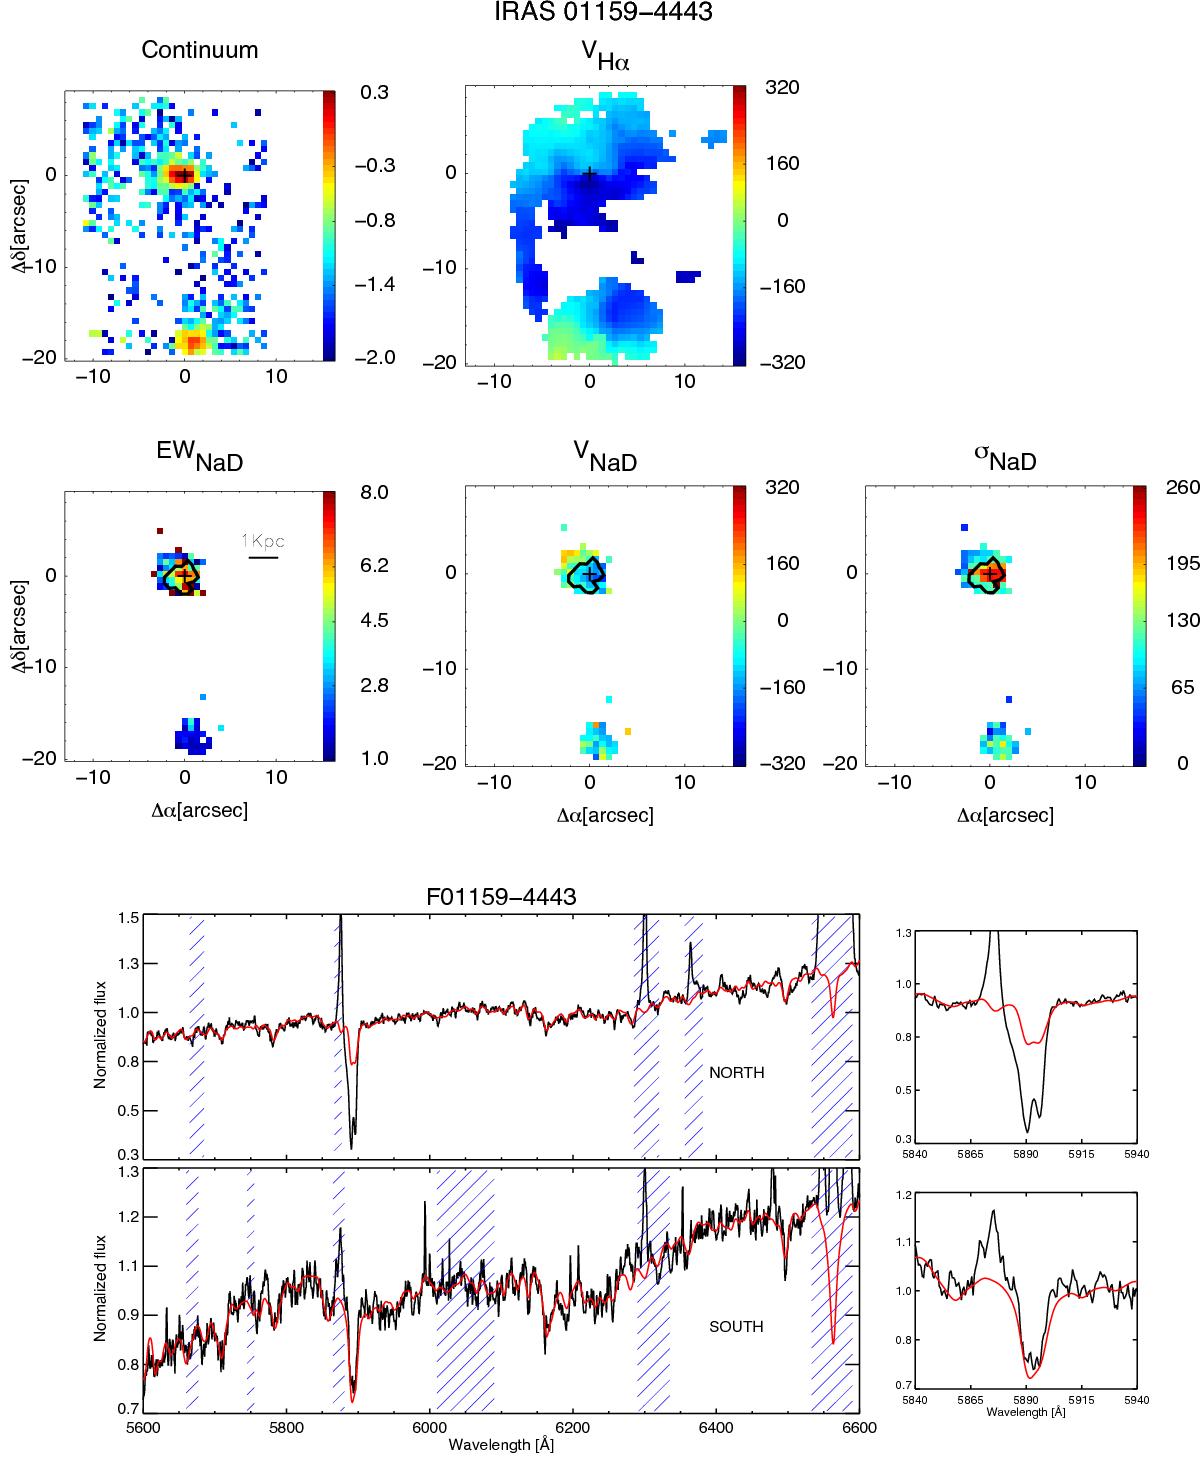
IRAS F01159-4443. Top: the continuum image obtained from the mean of the line-free continuum nearby the doublet in a 100 Å rest-frame wavelength range in units of erg s-1 cm-2 Å-1 after applying a factor of 10-16 and the ionized gas velocity field (in km s-1 units) traced via the Hα-narrow component (both included as reference). Center: VIMOS observed maps obtained modeling the NaD line profile (λλ 5890, 5896 Å). From left to right: equivalent width (in Å units), velocity, and velocity dispersion (both in km s-1 units). In all the maps, the brightest spaxel of the VIMOS continuum is indicated with a cross and the orientation of the galaxies is north up, east to the left. The maps are color coded according to their own scale (i.e., range of the velocity, velocity dispersion, and EWs sampled) to facilitate the contrast and to highlight weak features. Black contours (if present) indicate the spaxels in which the neutral gas is identified as entrained in a GW. Bottom: the rest-frame spectra extracted from the original cube via a S/N optimization algorithm (Sect. 3.1) for the northern and southern galaxies. The red line indicates the modeled stellar spectrum that matches the observed continuum, obtained applying the pPXF method. The most relevant spectral features blocked for modeling a line-free continuum are shown in blue.
Current usage metrics show cumulative count of Article Views (full-text article views including HTML views, PDF and ePub downloads, according to the available data) and Abstracts Views on Vision4Press platform.
Data correspond to usage on the plateform after 2015. The current usage metrics is available 48-96 hours after online publication and is updated daily on week days.
Initial download of the metrics may take a while.