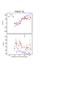
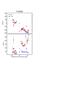
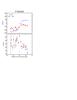
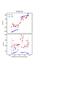
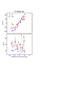
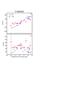
Fig. 13
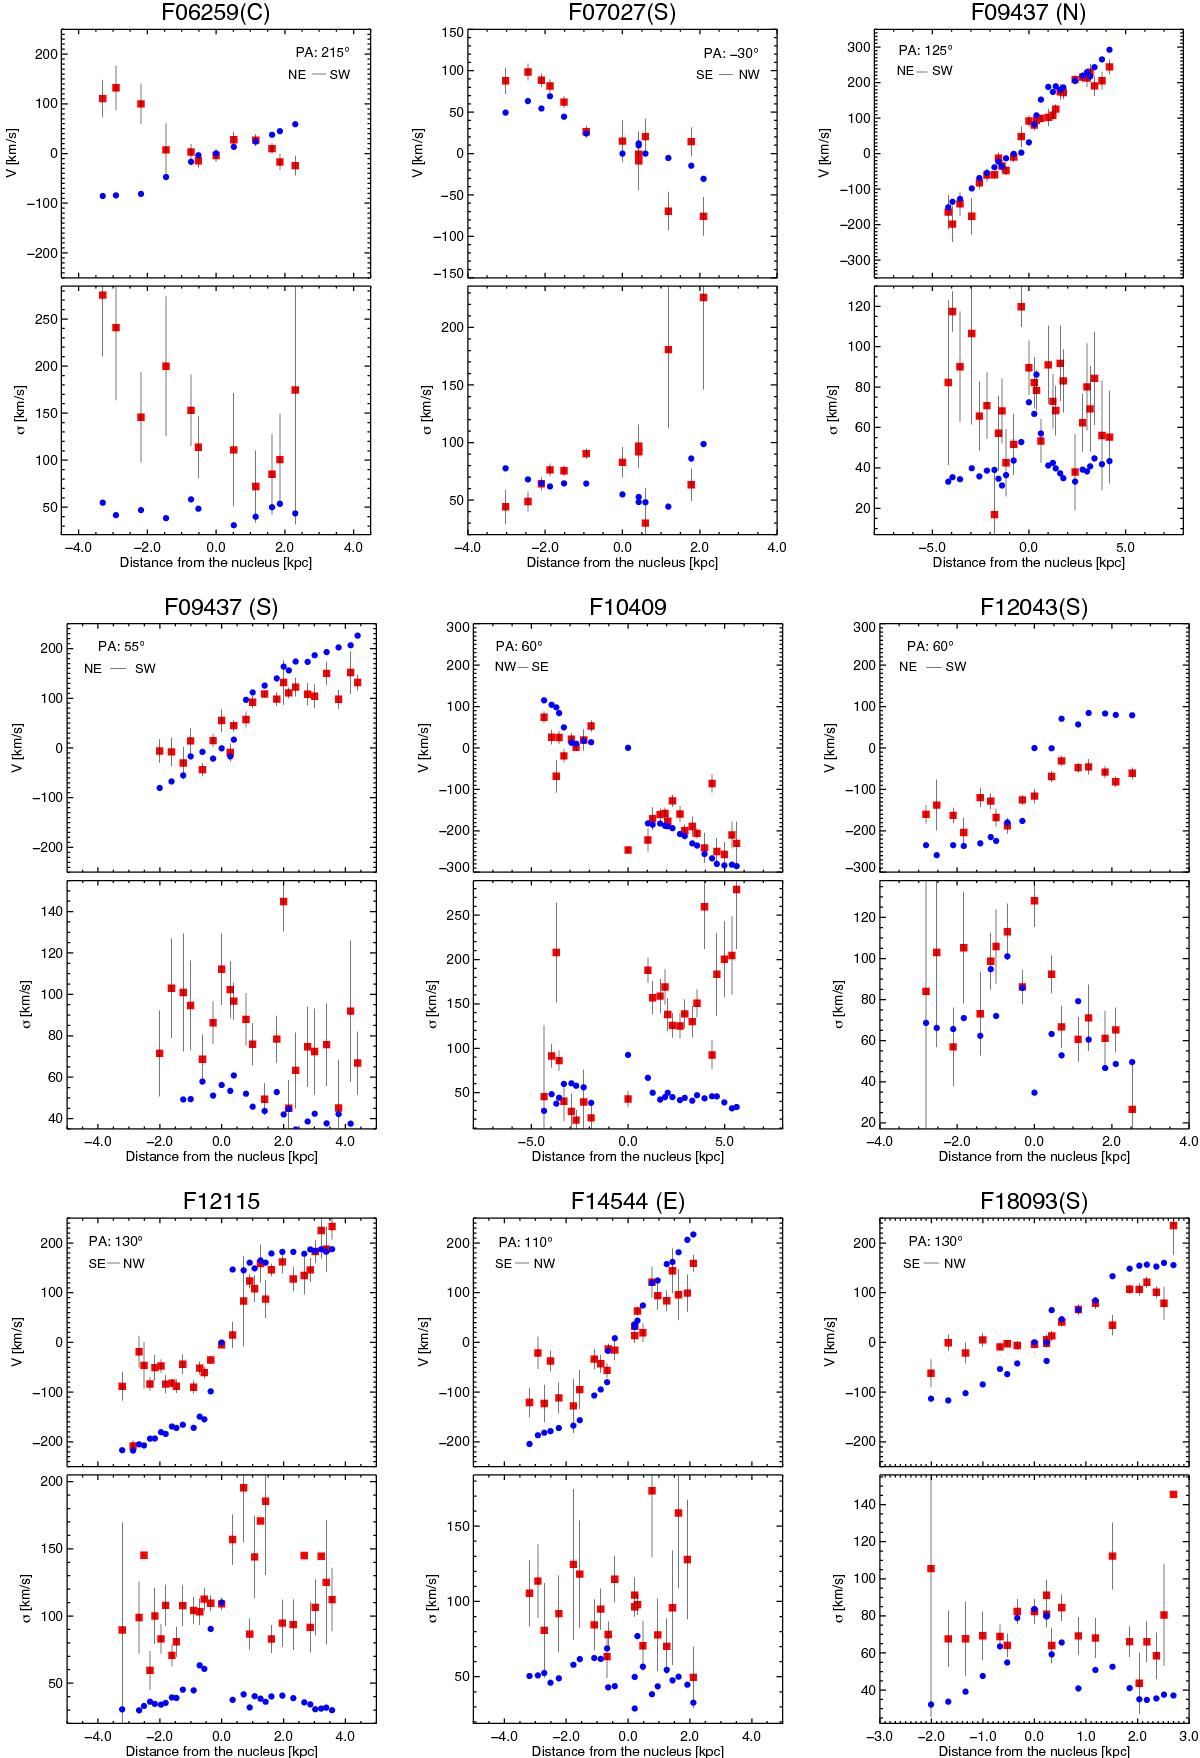
PV-curves (top) and velocity dispersion radial profiles (bottom) for those galaxies classified as disks (Table 5). These curves were obtained considering a pseudo-slit aligned according to the major axis of the neutral gas rotation (traced via NaD). In all panels, the red squares and blue circles indicate the points for the neutral and ionized gas, respectively, which is traced via the NaD absorption and Hα emission (narrow component). The galaxy IDs follow that of Table 1, although here they are shortened for a better visualization. The velocity fields of Hα have been taken as reference for an ordinary rotation and typically extend up to a radius larger than the NaD velocity field. For a detailed analysis of the ionized gas kinematics, we refer to Bellocchi et al. (2013). The LIRG IRAS 11506-3851 is discussed in detail by Cazzoli et al. (2014) thus the correspondent panel is not included here.
Current usage metrics show cumulative count of Article Views (full-text article views including HTML views, PDF and ePub downloads, according to the available data) and Abstracts Views on Vision4Press platform.
Data correspond to usage on the plateform after 2015. The current usage metrics is available 48-96 hours after online publication and is updated daily on week days.
Initial download of the metrics may take a while.