Fig. 1
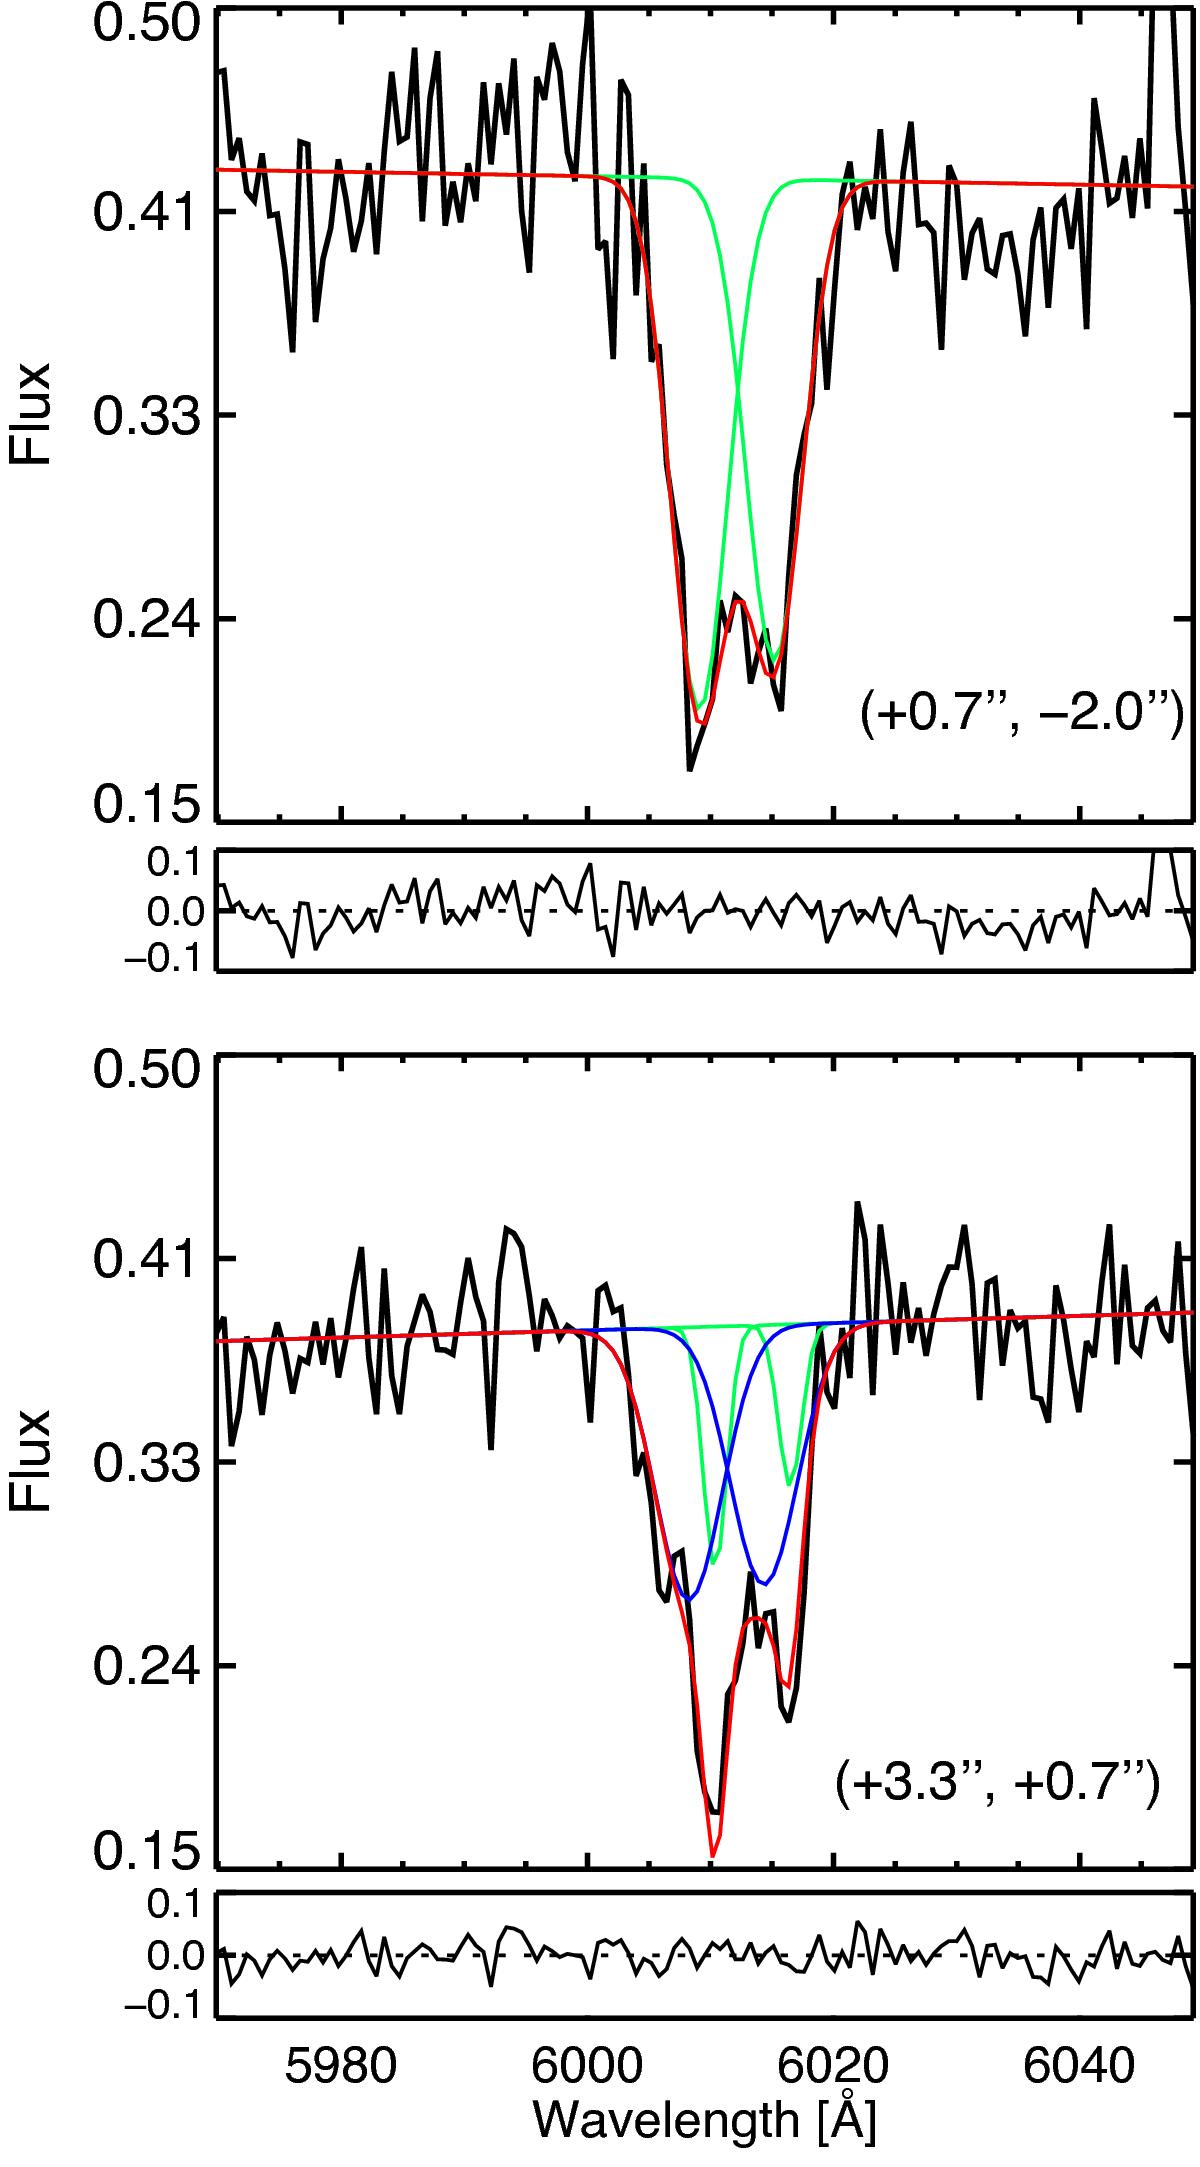
Examples of one (top) and two (bottom) component(s) Gaussian fits to the NaD line profiles in two different spaxels in IRAS F10409-4556. Below, the residuals (i.e., data – model) are presented. When fitting two components the blueshifted component is shown in blue (bottom panel only). The red curve shows the total contribution coming from the NaD Gaussian fit. In bracket, the spaxels coordinates indicated as distance from the nucleus (i.e., map center, Fig. A.23).
Current usage metrics show cumulative count of Article Views (full-text article views including HTML views, PDF and ePub downloads, according to the available data) and Abstracts Views on Vision4Press platform.
Data correspond to usage on the plateform after 2015. The current usage metrics is available 48-96 hours after online publication and is updated daily on week days.
Initial download of the metrics may take a while.