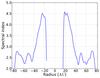
Fig. 7
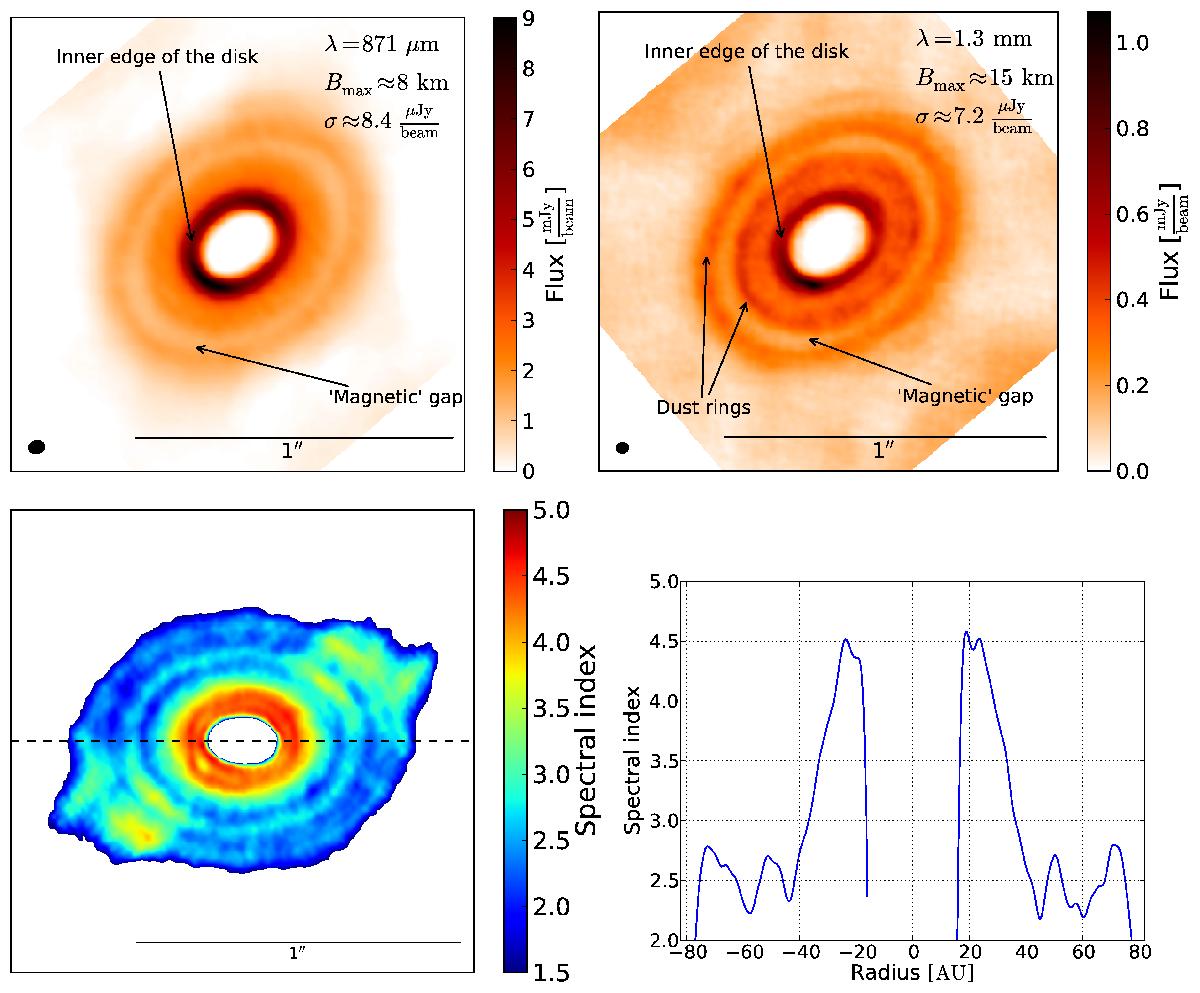
Top: simulated ALMA images of the disk after 150 inner orbits (18 900 yr) at a wavelength of 871 μm (left) and 1.3 μm (right). The position, the disk inclination, distance, and stellar luminosity of HL Tau were used for these simulation. At both wavelengths, a gap is visible. The gap in the images is emphasized and we note that its origin lies in the magnetic field in the disk, and not a planet. Bottom left: spatially resolved map of the spectral index calculated from the simulated observation on the top. The map is rotated clockwise by 40° in comparison to the maps at the top. Bottom right: profile of the spectral index along the cut, indicated by a dashed line on the bottom left figure.
Current usage metrics show cumulative count of Article Views (full-text article views including HTML views, PDF and ePub downloads, according to the available data) and Abstracts Views on Vision4Press platform.
Data correspond to usage on the plateform after 2015. The current usage metrics is available 48-96 hours after online publication and is updated daily on week days.
Initial download of the metrics may take a while.