Fig. 6
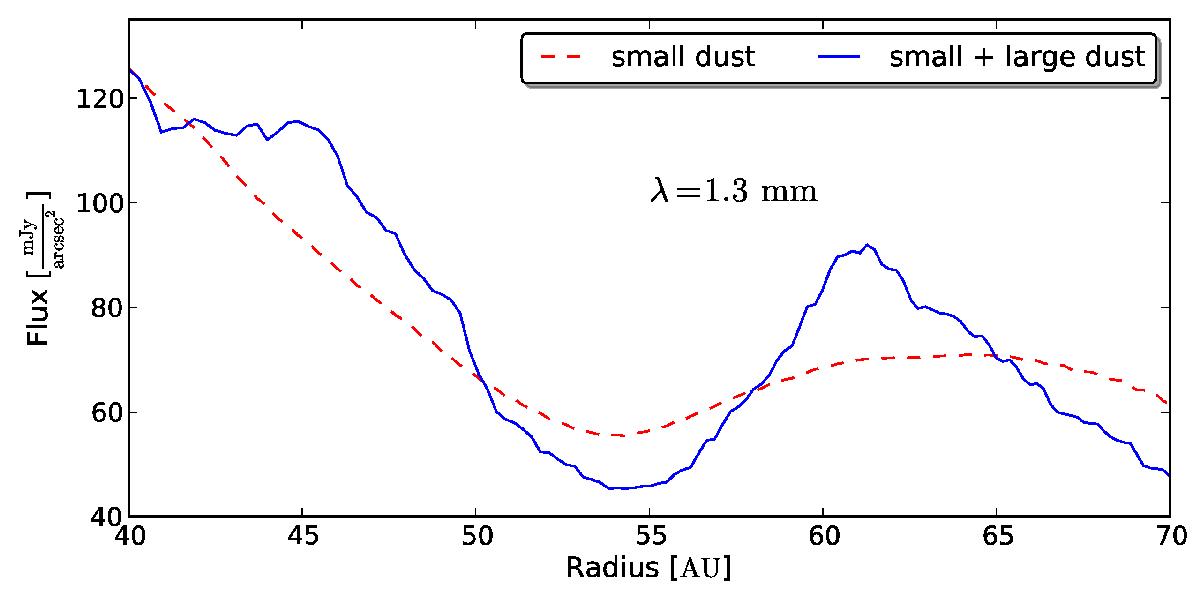
Comparison of radial brightness profiles of the disk after 150 inner orbits (18 900 yr) with (solid blue line) and without additional large dust particles (dashed red line) at a wavelength of 1.3 mm. The contrast ratio between the brightness minimum, which corresponds to the gap center, and the brightness maximum of the disk for radii >55 au is enlarged by a factor of ~1.5 through the additional large dust particles, in comparison to the case with only small grains. The total number of grains particles Nmax is the same for both the blue and the red curve (see Appendix A), which means that the number of small grains used to compute the red curve is reduced in comparison to the blue-lined case. This leads to a decreased flux at the gap center.
Current usage metrics show cumulative count of Article Views (full-text article views including HTML views, PDF and ePub downloads, according to the available data) and Abstracts Views on Vision4Press platform.
Data correspond to usage on the plateform after 2015. The current usage metrics is available 48-96 hours after online publication and is updated daily on week days.
Initial download of the metrics may take a while.