Fig. 5
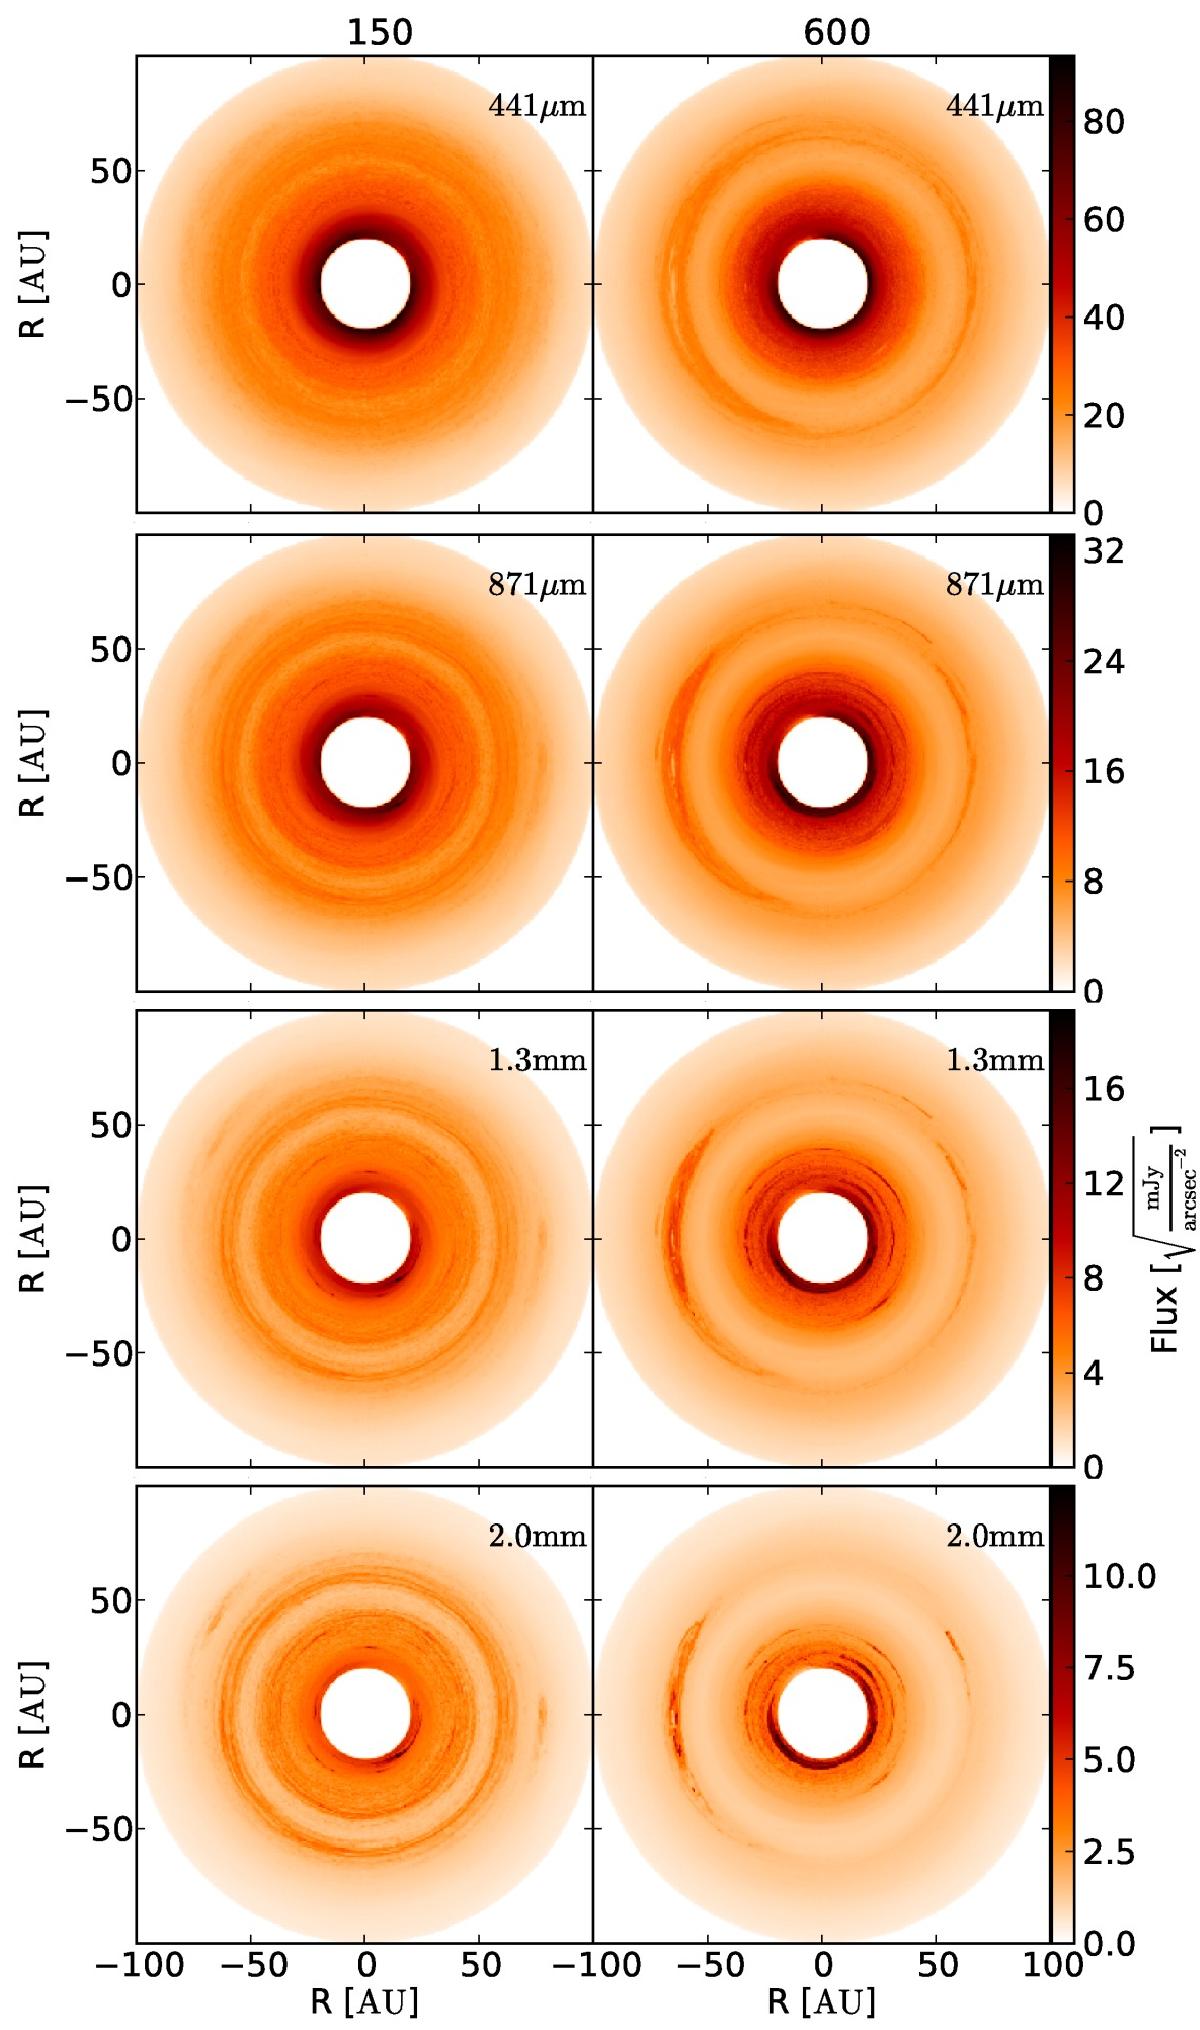
Selected re-emission maps for the disk after 150 inner orbits (18 900 yr, left column) and 600 (75 600 yr, right column). Each wavelength (441 μm, 871 μm, 1.3 mm and 2.0 mm) is presented in its own line. The square root of thermal re-emission flux per arcsec2 is shown color-coded. At both time steps and for every wavelength a gap is visible in the maps. Depending on time and wavelength, the re-emission maps of the disk show different structures (rings and concentrations).
Current usage metrics show cumulative count of Article Views (full-text article views including HTML views, PDF and ePub downloads, according to the available data) and Abstracts Views on Vision4Press platform.
Data correspond to usage on the plateform after 2015. The current usage metrics is available 48-96 hours after online publication and is updated daily on week days.
Initial download of the metrics may take a while.