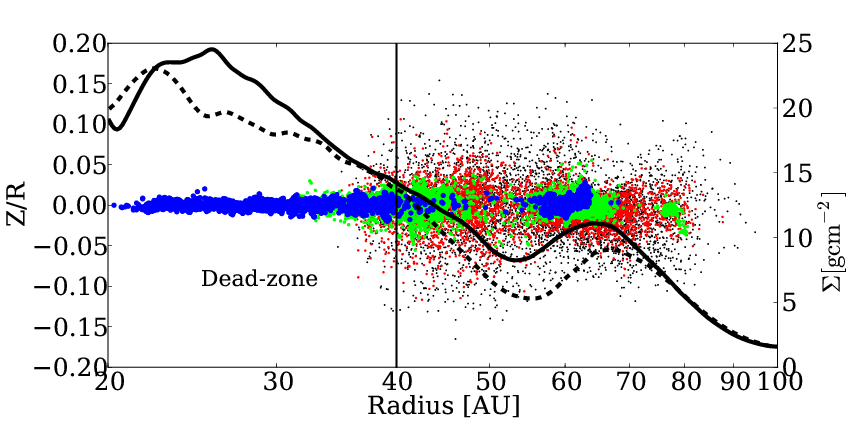
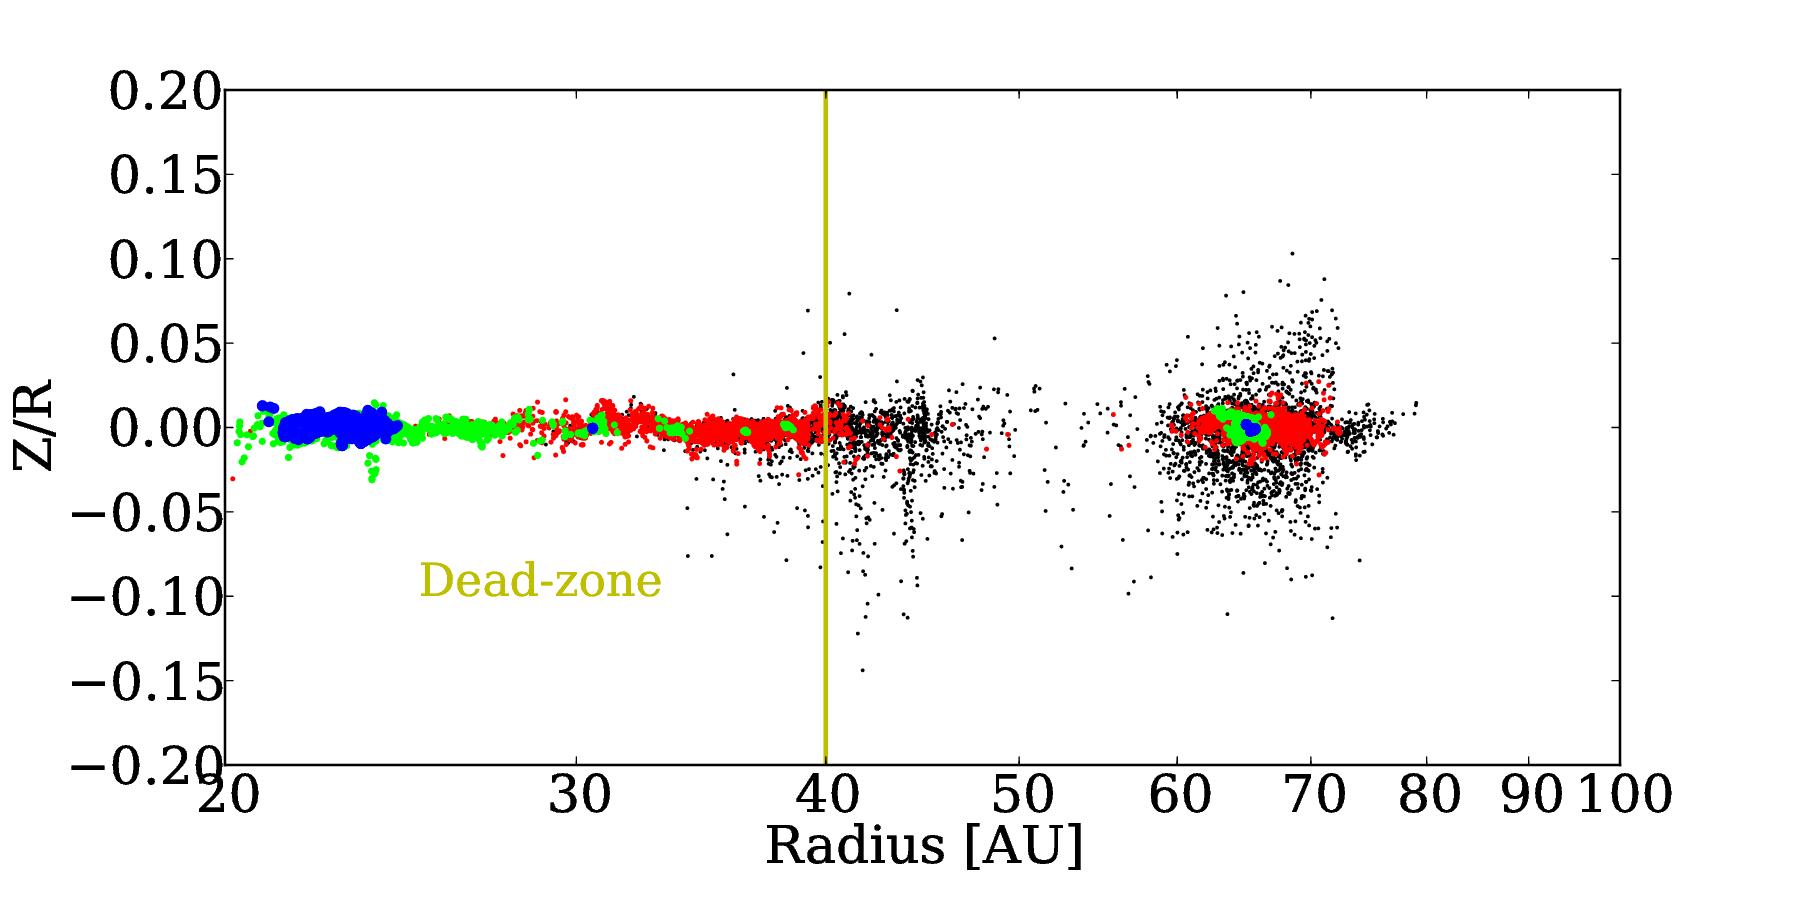
Fig. 3
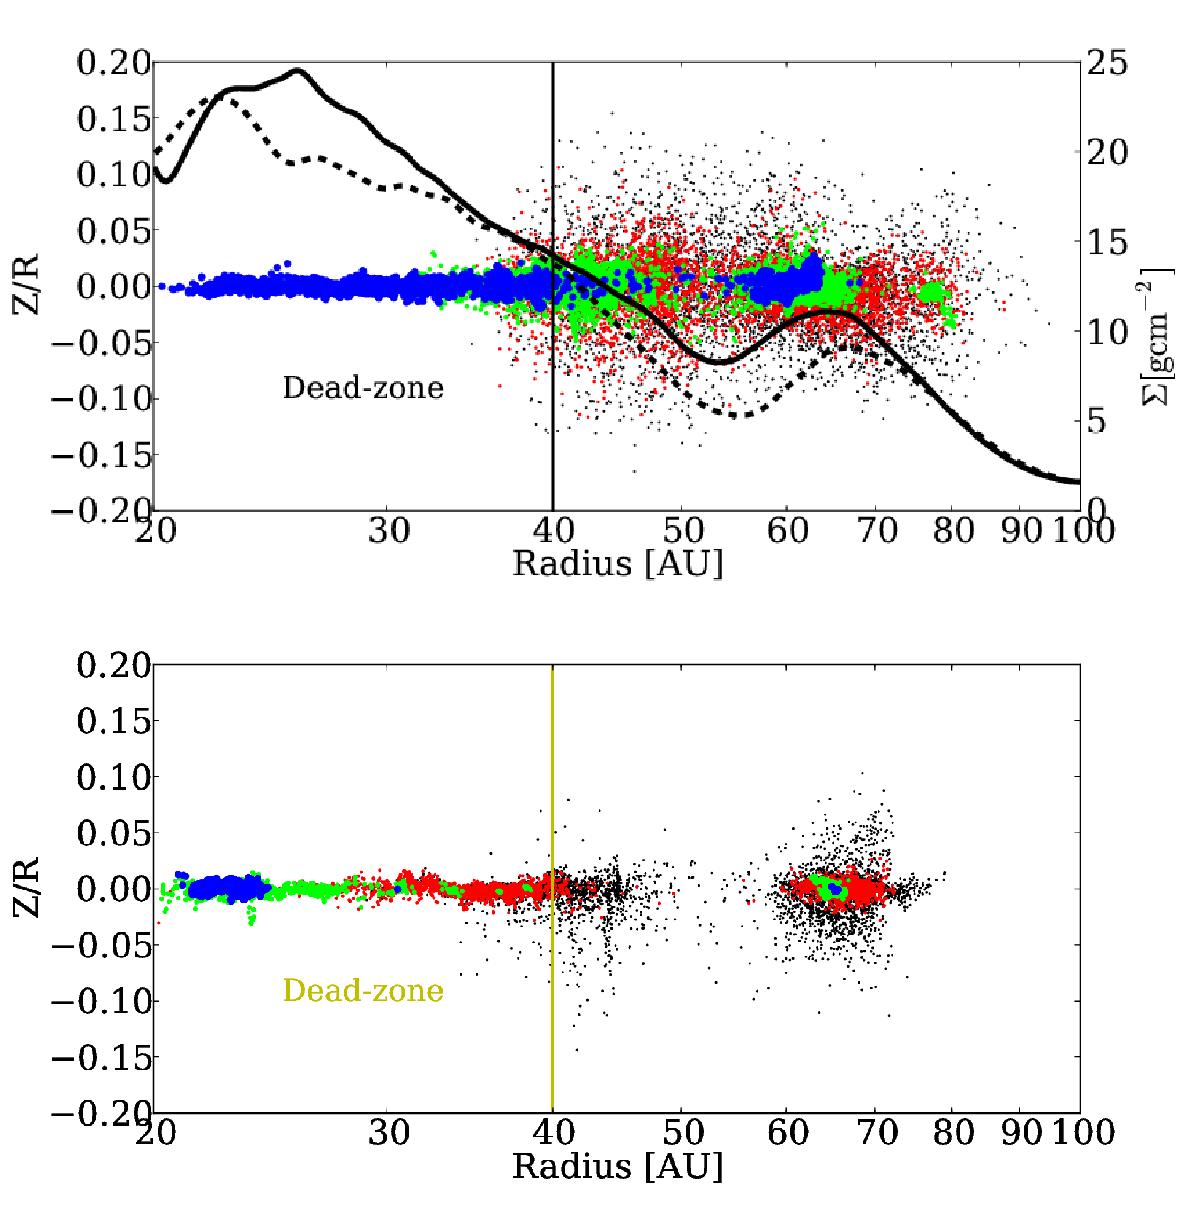
Scatter plot of every tenth particle in four selected size bins of the disk in edge-on orientation for the time step after 150 inner orbits (top) and 600 inner orbits (bottom). The dead-zone outer edge is indicated in the plot. Particles are color-coded according to their size, as in Fig. 2. The black solid line shows the surface density profile of the disk after 150 inner orbits (18 900 yr), the dashed line shows this profile for the disk after 600 inner orbits (75 600 yr).
Current usage metrics show cumulative count of Article Views (full-text article views including HTML views, PDF and ePub downloads, according to the available data) and Abstracts Views on Vision4Press platform.
Data correspond to usage on the plateform after 2015. The current usage metrics is available 48-96 hours after online publication and is updated daily on week days.
Initial download of the metrics may take a while.