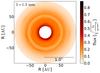
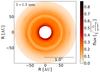
Fig. B.3
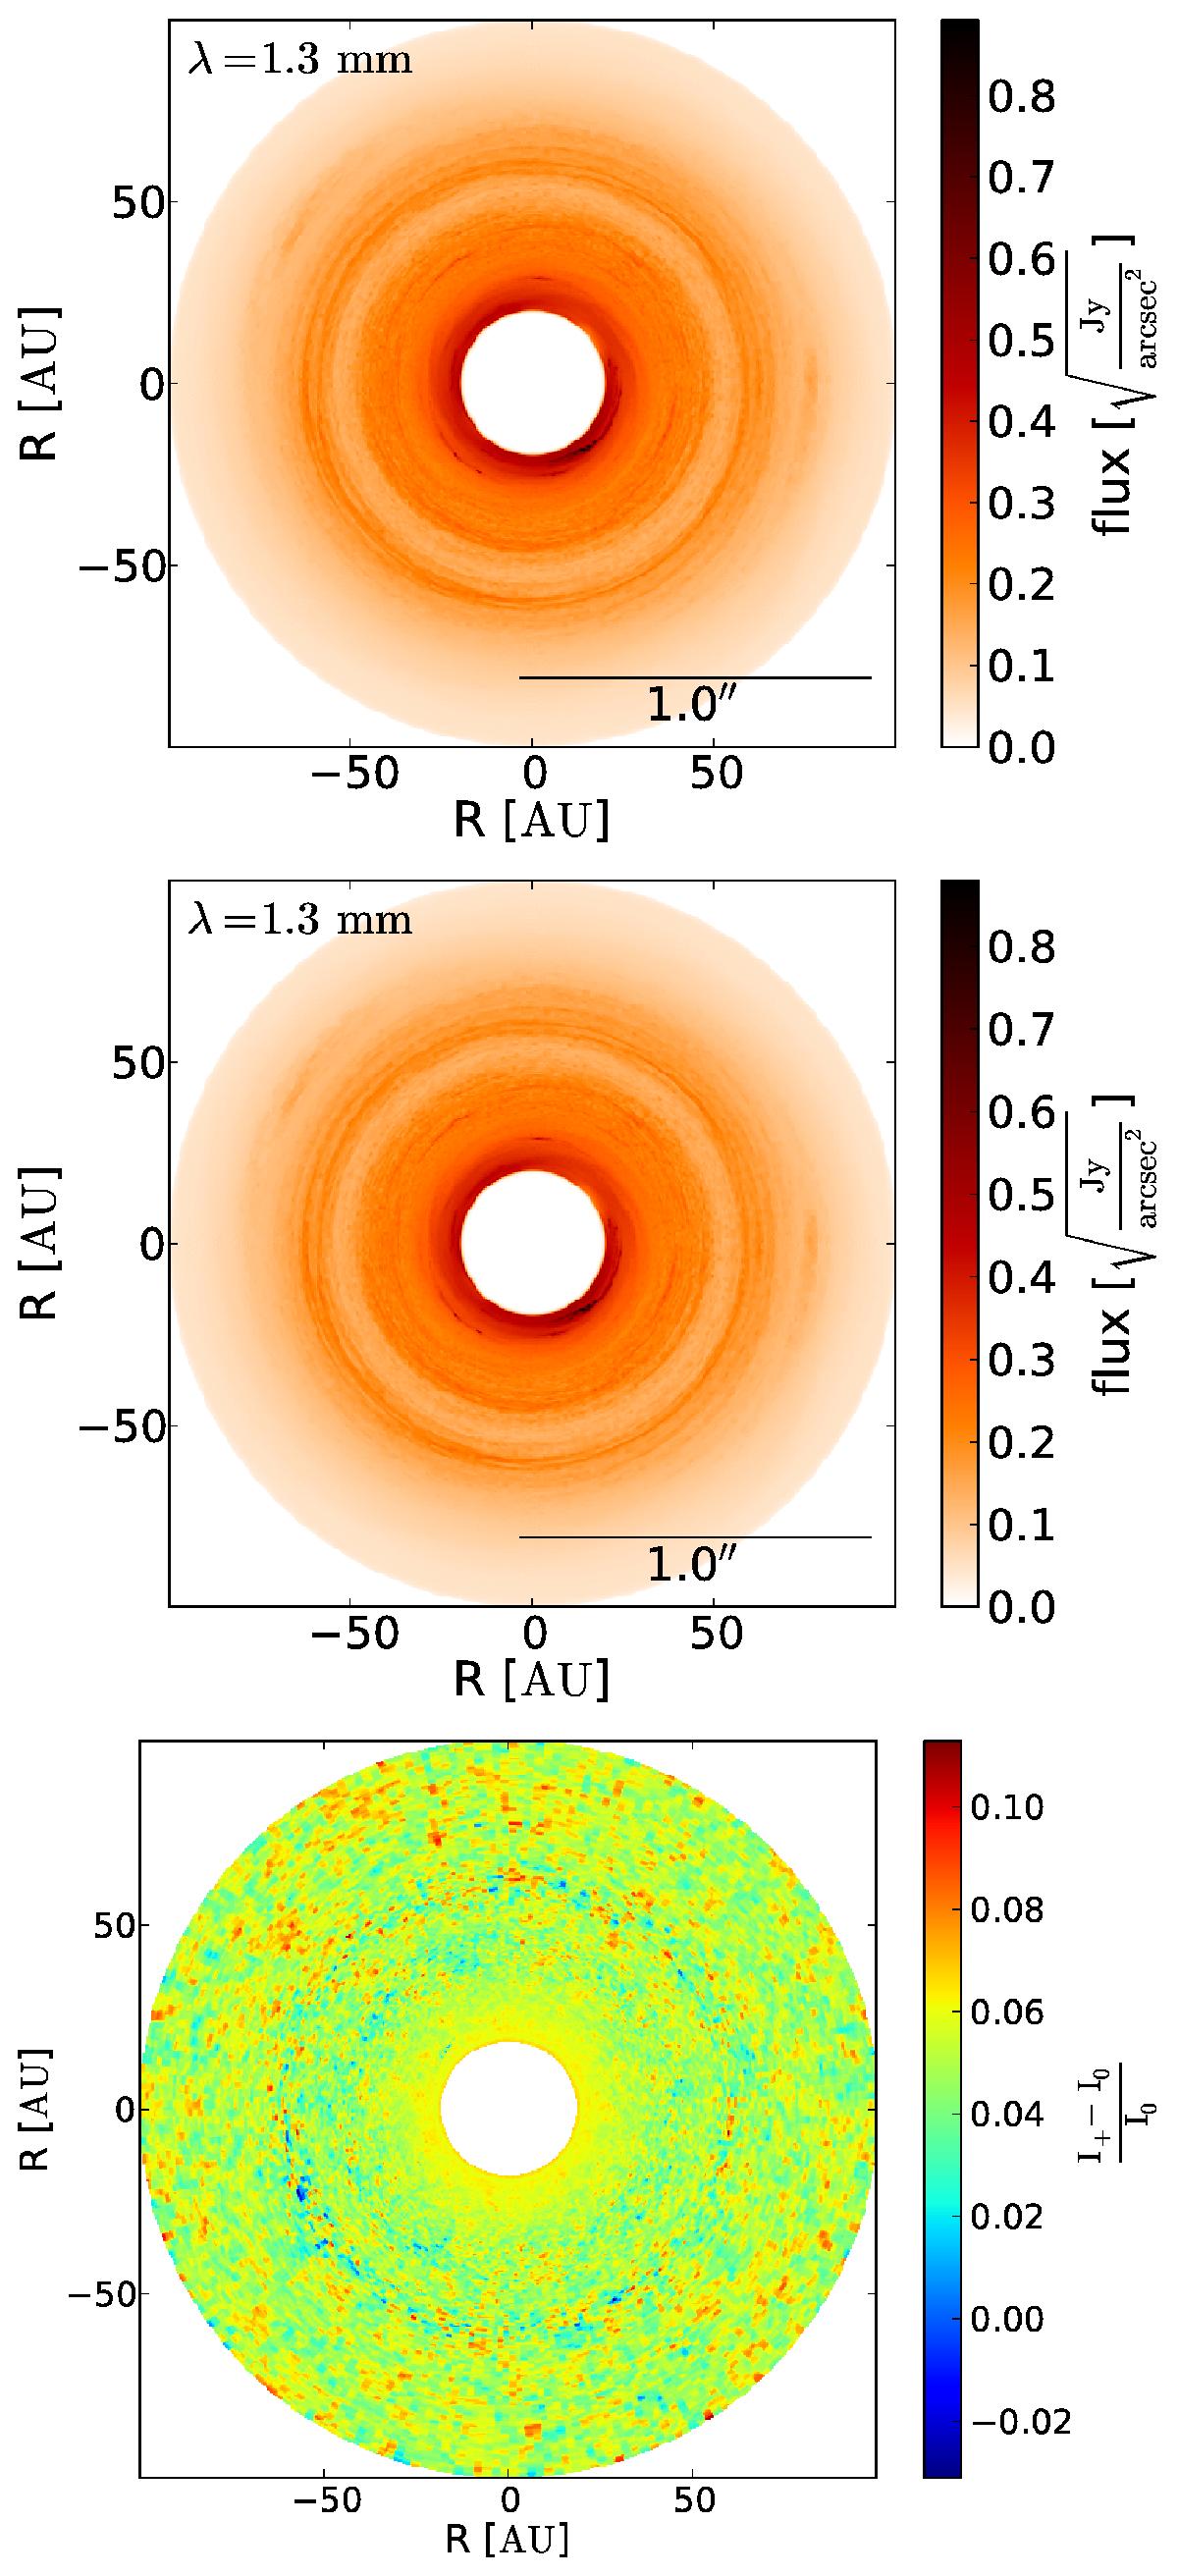
Selected re-emission map at a wavelength of 1.3 mm of a disk model including 5 × 10⁵ (top), 5 × 10⁶ (middle) initial larger dust particles and the relative intensity deviations between those two models (bottom). The differences show deviations in the order of several percent.
Current usage metrics show cumulative count of Article Views (full-text article views including HTML views, PDF and ePub downloads, according to the available data) and Abstracts Views on Vision4Press platform.
Data correspond to usage on the plateform after 2015. The current usage metrics is available 48-96 hours after online publication and is updated daily on week days.
Initial download of the metrics may take a while.