Free Access
Fig. 6
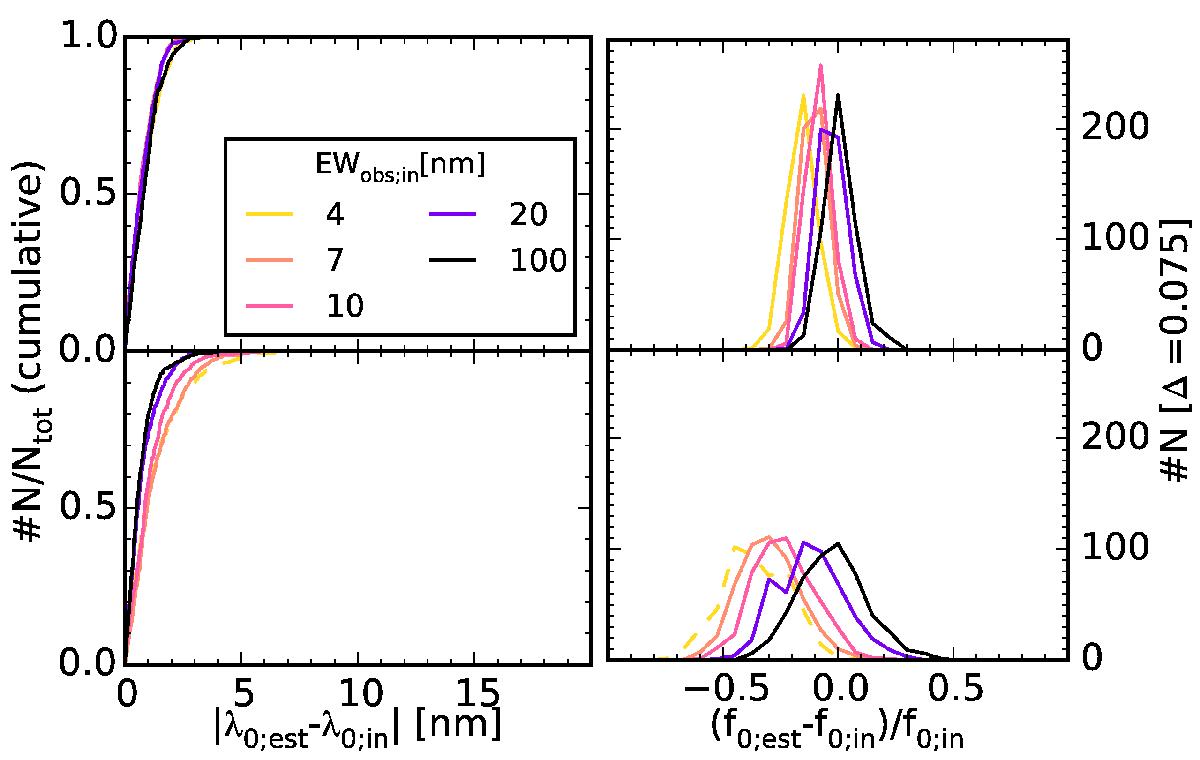
Distributions of best-fit wavelength and flux similar to Fig. 5. Here, distributions for five different EWobs;in are shown. EWobs;in values stated in the legend are in units of nm. The input flux was 10 × 10-17 ergs-1cm-2 in all cases.
Current usage metrics show cumulative count of Article Views (full-text article views including HTML views, PDF and ePub downloads, according to the available data) and Abstracts Views on Vision4Press platform.
Data correspond to usage on the plateform after 2015. The current usage metrics is available 48-96 hours after online publication and is updated daily on week days.
Initial download of the metrics may take a while.