Fig. 5
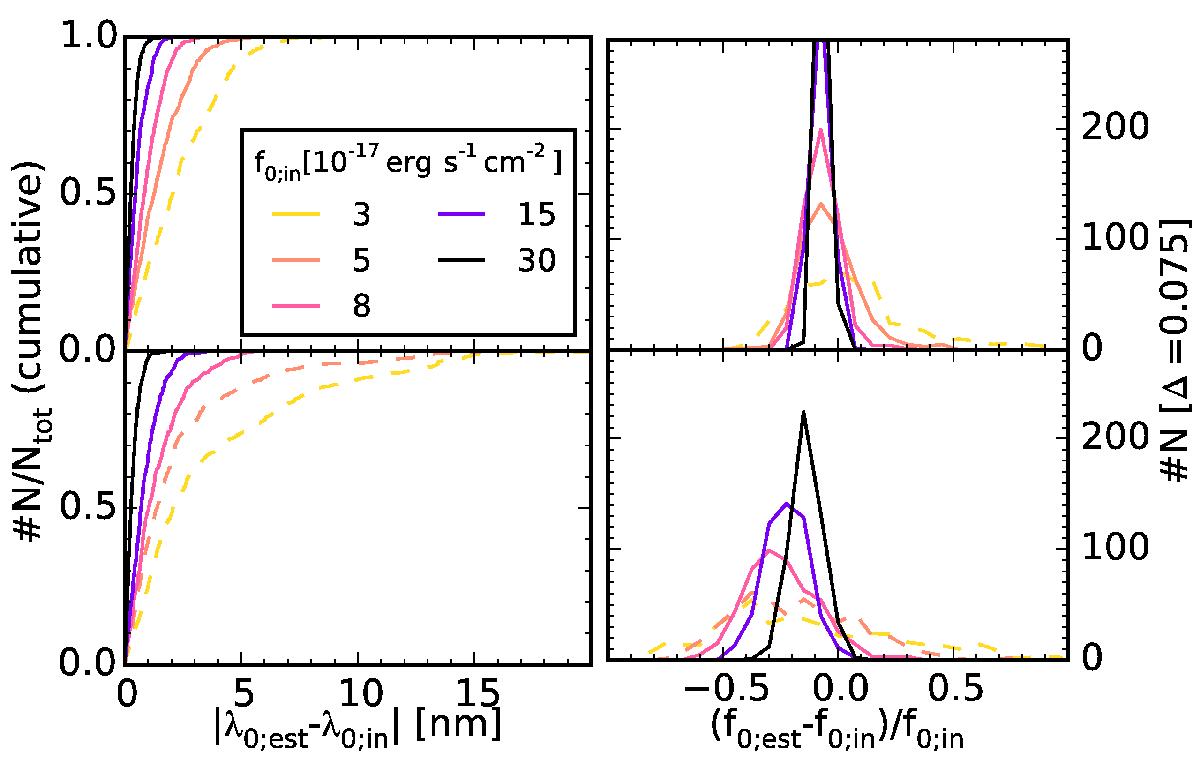
Distributions of the best-fit wavelength λ0;est (left panels; cumulative) and flux f0;est (right panels) for input spectra with an emission line at the effective wavelength (top panels) and at 50% transmittance (bottom panels) of the two NB118 filters’ combined passband. In each panel, distributions are shown for five different Ha fluxes. The respective values are listed in the legend in units of ergs-1cm-2. The input EWobs;in was 10 nm in all five cases. Fits were obtained at both transmittances for 500 realizations of simulated observations in NB118 14 and 15, Y, J, and H. Dashed lines indicate that the objects would not be selected as NB excess objects.
Current usage metrics show cumulative count of Article Views (full-text article views including HTML views, PDF and ePub downloads, according to the available data) and Abstracts Views on Vision4Press platform.
Data correspond to usage on the plateform after 2015. The current usage metrics is available 48-96 hours after online publication and is updated daily on week days.
Initial download of the metrics may take a while.