Fig. 4
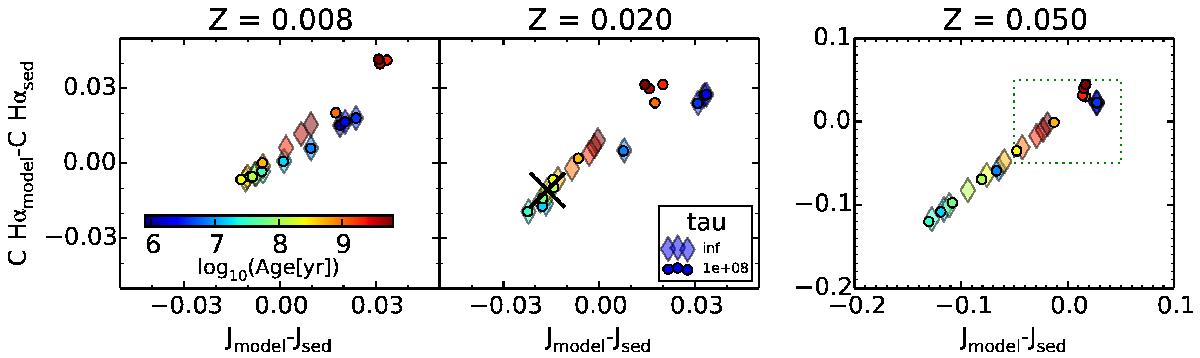
Difference between the continuum of synthetic spectral energy distributions (SED) and the estimate obtained from a power law fit to these SEDs (model) using Y, J, and H filters. The magnitude difference between Jmodel and Jsed is plotted against the magnitude difference between SED and model directly at the wavelength of Hα (cf. Sect. 4.2). The range of SED parameters, for which results are shown, is summarized in Table 1. For the Z = 0.05 panel, a wider axis scale was chosen than in the other two cases. The narrower range used for Z = 0.008 and Z = 0.020 = Z⊙ is indicated as dotted box in the Z = 0.05 case. The cross in the Z = 0.020 plot represents the SED, which was used for the parameter estimation test described in Sect. 4.3.
Current usage metrics show cumulative count of Article Views (full-text article views including HTML views, PDF and ePub downloads, according to the available data) and Abstracts Views on Vision4Press platform.
Data correspond to usage on the plateform after 2015. The current usage metrics is available 48-96 hours after online publication and is updated daily on week days.
Initial download of the metrics may take a while.