Fig. 3
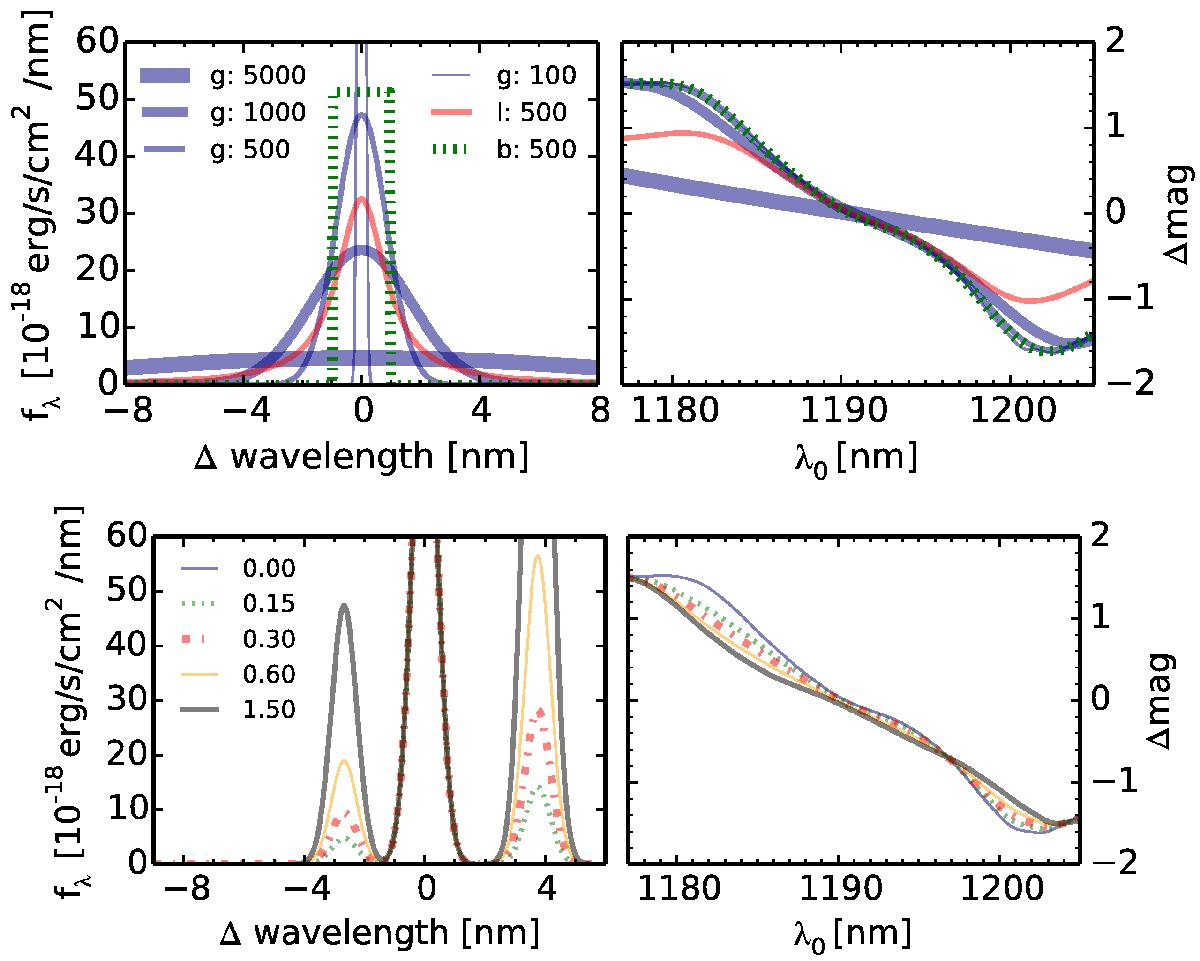
Impact of the line shape (upper panels) and the presence of multiple lines (lower panels) on the predicted Δmag − λ0 curves. The left panels show different input spectra, and the right panels the corresponding Δmag – λ0 curves. “g”, “l”, and “b” in the legend refer to Gaussian, boxcar, and Lorentzian, respectively, with the succeeding numbers stating the line FWHM in kms-1. The presence of multiple lines is demonstrated for the relevant example of the [N ii] doublet bracketing Hα, with the values in the legend corresponding to the assumed [N ii]λ6583 to Hα ratios. All the shown results are based on the same filter combination as used for Fig. 1.
Current usage metrics show cumulative count of Article Views (full-text article views including HTML views, PDF and ePub downloads, according to the available data) and Abstracts Views on Vision4Press platform.
Data correspond to usage on the plateform after 2015. The current usage metrics is available 48-96 hours after online publication and is updated daily on week days.
Initial download of the metrics may take a while.