Fig. F.2
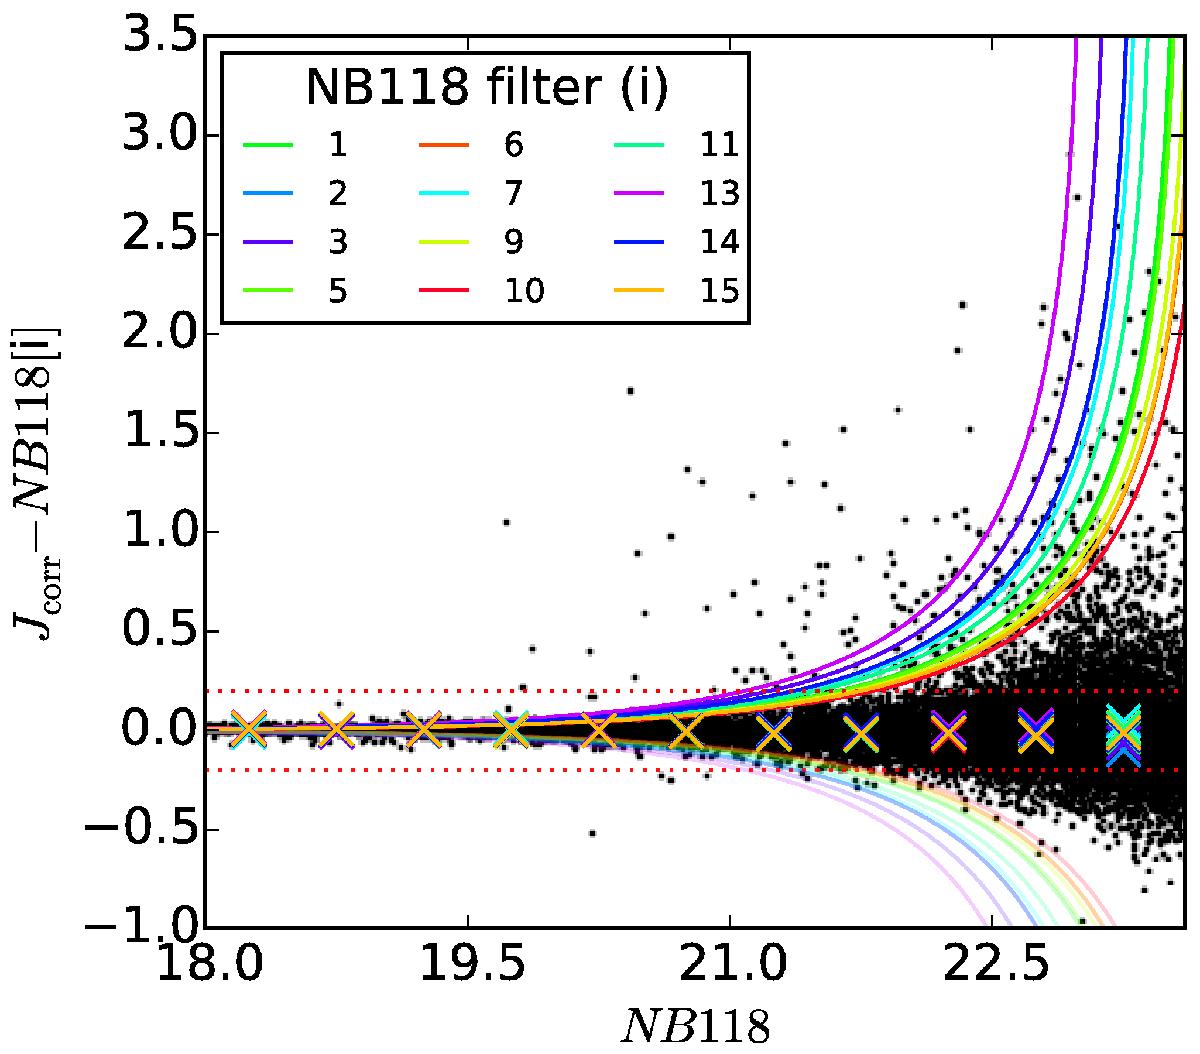
Measured NB excess as a function of the NB118 magnitude for all objects in the main NB118 detected catalog. Data is only included for the regions of overlapping filters and in each of the overlapping regions only for one of the two filters. The red-dotted horizontal line indicates the minimum required NB118 excess for objects that we classify as NB excess objects. In addition, the curves for a 4σ positive Jcorr − NB118 [ i ] are shown for each of the 12 filters. The crosses show the median of the Jcorr − NB118 in NB118 bins with a width of 0.5 mag. Finally, all mentioned lines are also plotted mirrored at Jcorr − NB118 [ i ] = 0.
Current usage metrics show cumulative count of Article Views (full-text article views including HTML views, PDF and ePub downloads, according to the available data) and Abstracts Views on Vision4Press platform.
Data correspond to usage on the plateform after 2015. The current usage metrics is available 48-96 hours after online publication and is updated daily on week days.
Initial download of the metrics may take a while.