Fig. D.1
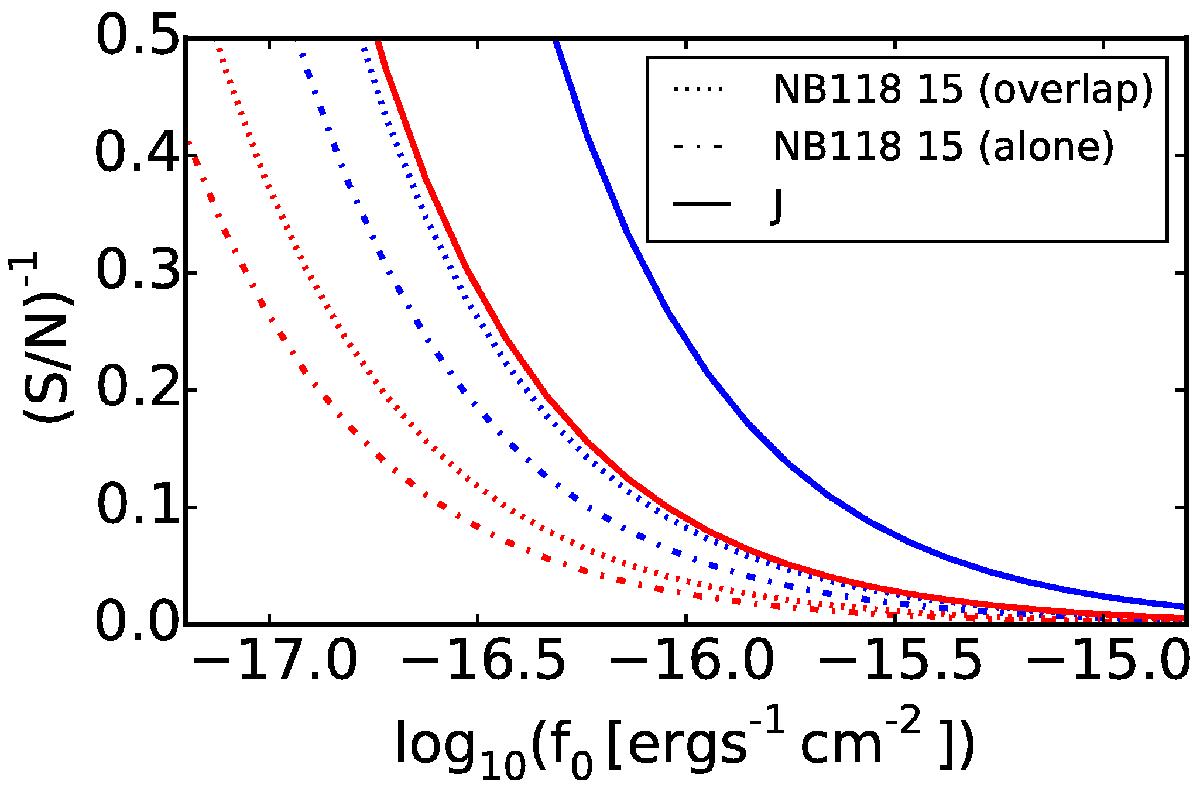
Inverse of the signal-to-noise as a function of line flux for an infinite EW line in J and at peak transmittance of NB118 filter 15. Curves are shown both for exposure times as in the UltraVISTA DR2 (blue) and for the final UltraVISTA survey (red). Moreover, for the NB118 filter, results are included both for the typical per pixel integration time (alone) and for half this value (overlap) (cf. Sect. 5.1).
Current usage metrics show cumulative count of Article Views (full-text article views including HTML views, PDF and ePub downloads, according to the available data) and Abstracts Views on Vision4Press platform.
Data correspond to usage on the plateform after 2015. The current usage metrics is available 48-96 hours after online publication and is updated daily on week days.
Initial download of the metrics may take a while.