Fig. C.1
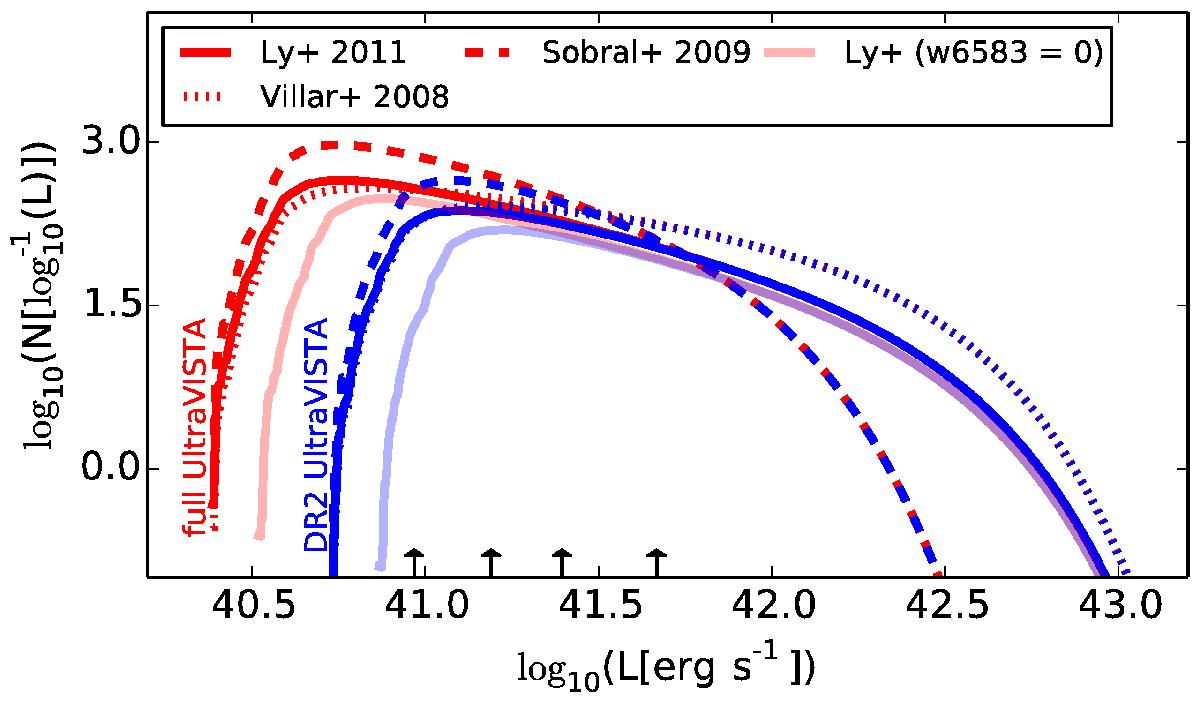
Expected number of Hα emitters in the part of the UltraVISTA NB118 field with data from two different NB118 filters as a function of line luminosity. Predicted curves are included both for the UltraVISTA DR2 (blue) and the final UltraVISTA (red) for three different z = 0.8Hα LFs from the literature. Results are plotted for the assumption of w6583 = 0.3 in all three cases. In the case of the Ly et al. (2011) LF, the curve for w6583 = 0 is also shown. Small arrows indicate luminosities corresponding to line fluxes of 3.0, 5.0, 10.0, and 20.0 × 10⁻¹⁷ erg s-1 cm-2. The integrated numbers for objects brighter than the respective marked fluxes are stated in Table C.1.
Current usage metrics show cumulative count of Article Views (full-text article views including HTML views, PDF and ePub downloads, according to the available data) and Abstracts Views on Vision4Press platform.
Data correspond to usage on the plateform after 2015. The current usage metrics is available 48-96 hours after online publication and is updated daily on week days.
Initial download of the metrics may take a while.