Fig. 18
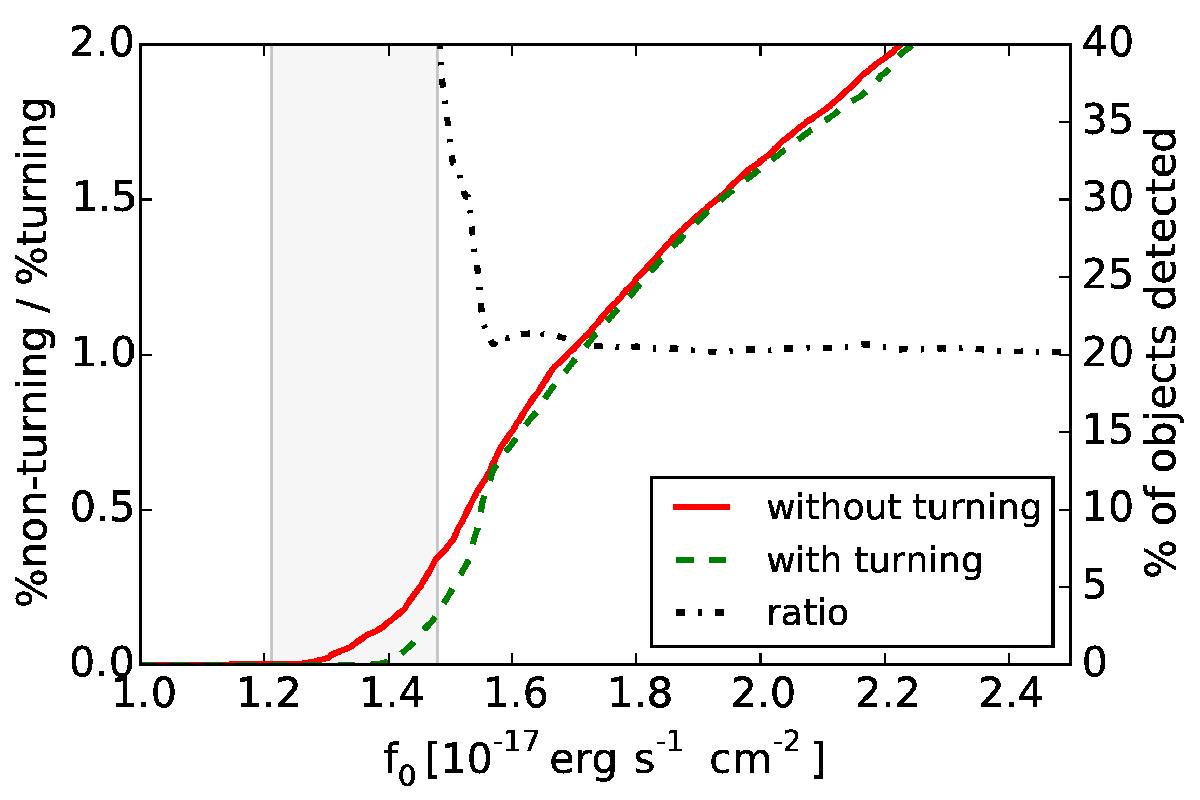
Simulated detection completeness as a function of line flux both for the standard UltraVISTA observing pattern (without turning; solid) and a possible modification (with turning; dashed). The dot-dashed line gives the ratio between the two completeness curves. Fluxes for which twice as many objects are expected in the standard pattern as in the modified pattern are indicated by the shaded area. No objects will be detected left of this area in either of the two observing patterns. The completeness curves were calculated for point sources with a spectrum consisting of a single infinite EW emission line. The underlying detection criterion was a color-significance of the NB118 excess in the stack including data from the 16 filters jointly at least at the 5σ level (cf. Sect. 5.9 for more details).
Current usage metrics show cumulative count of Article Views (full-text article views including HTML views, PDF and ePub downloads, according to the available data) and Abstracts Views on Vision4Press platform.
Data correspond to usage on the plateform after 2015. The current usage metrics is available 48-96 hours after online publication and is updated daily on week days.
Initial download of the metrics may take a while.