Fig. 16
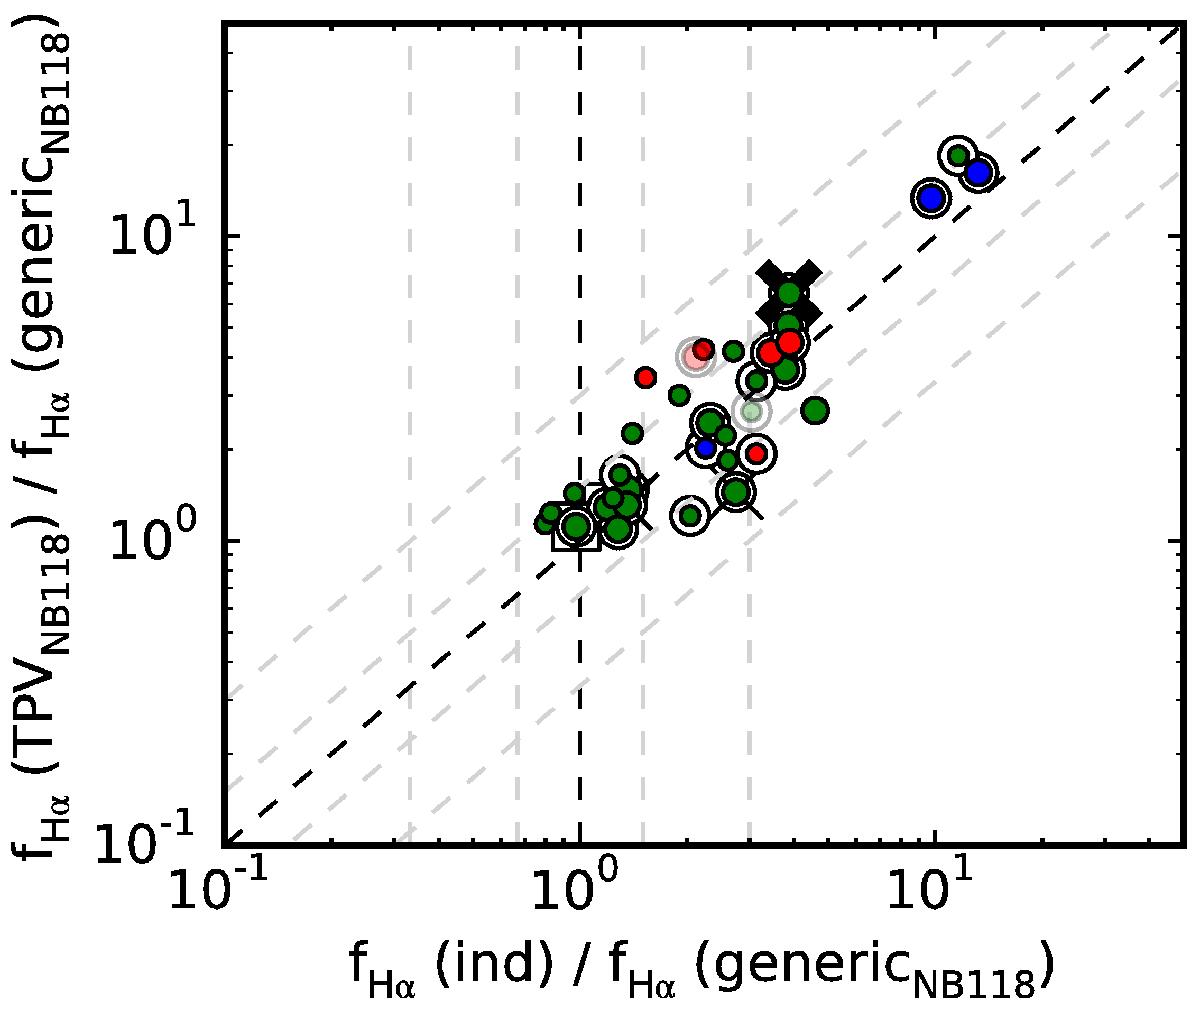
Ratio between the TPV and a generic NB118 flux estimate is plotted against the ratio between an independent flux estimate and the generic NB118 flux estimate. For objects on the diagonal the independent estimate and the TPV NB118 estimate are identical. The dashed lines indicate factors of 1.5 and 3 between the estimates. The symbols are explained in the legend of Fig. 15.
Current usage metrics show cumulative count of Article Views (full-text article views including HTML views, PDF and ePub downloads, according to the available data) and Abstracts Views on Vision4Press platform.
Data correspond to usage on the plateform after 2015. The current usage metrics is available 48-96 hours after online publication and is updated daily on week days.
Initial download of the metrics may take a while.