Fig. 15
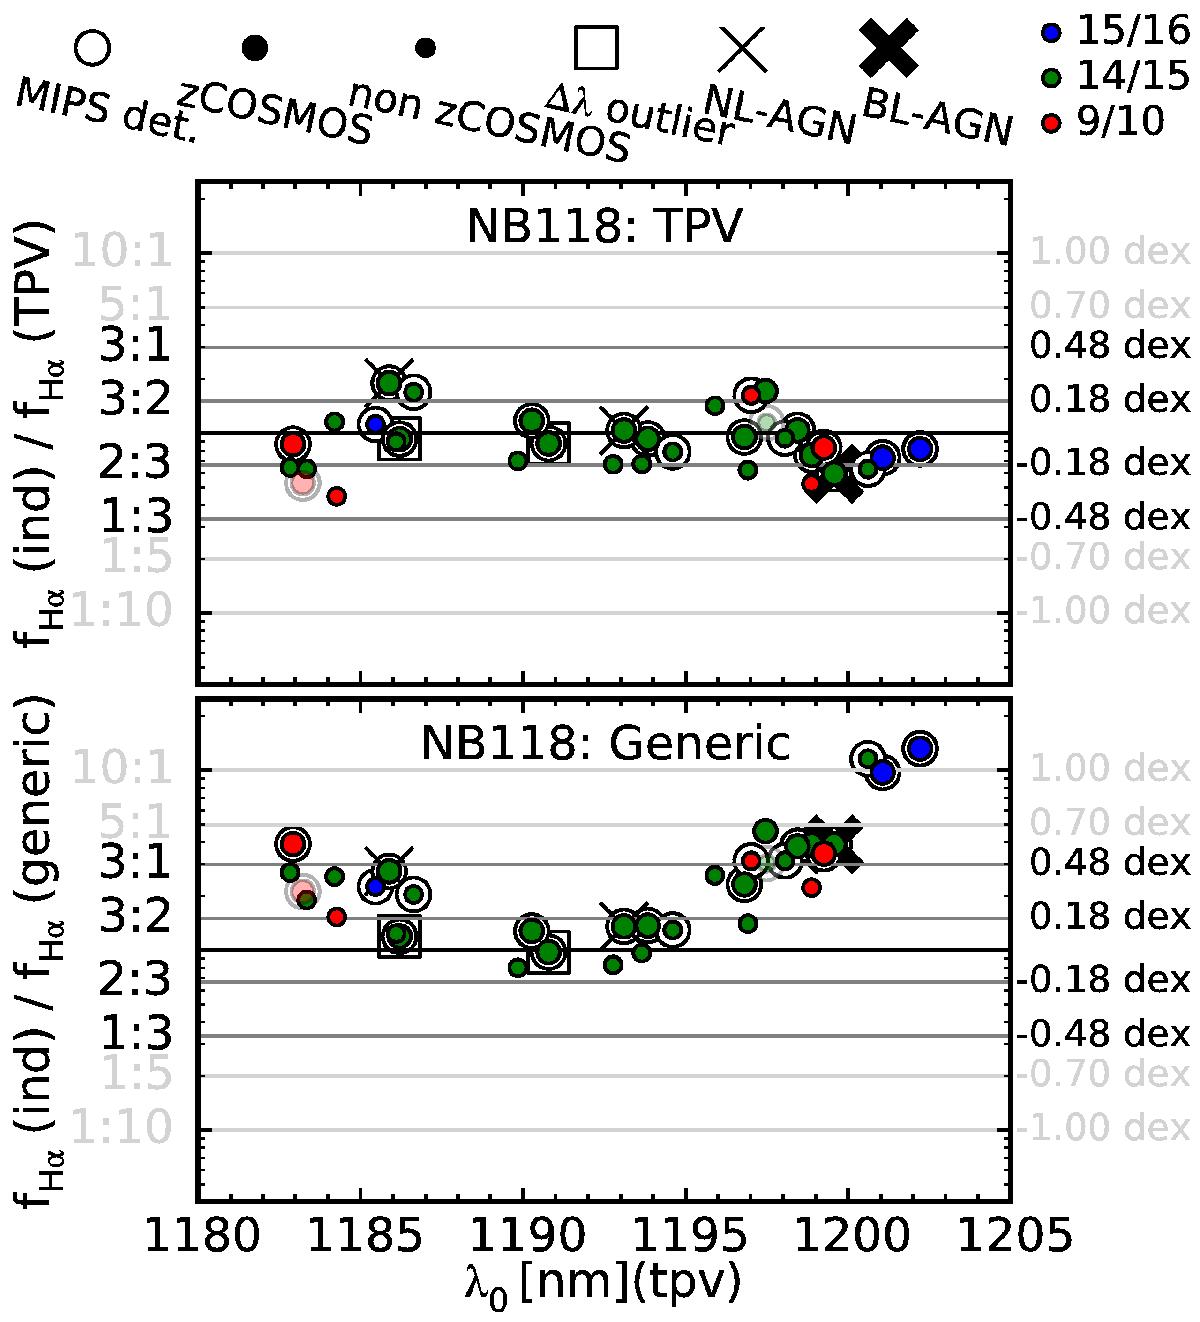
Upper panel: ratios between the Hα fluxes estimated from a combination of different methods, which are independent of the NB118 data (ind; cf. Sects. 5.6 and 5.7), and those estimated based on the NB118 data using the TPV technique. Colors refer to the three considered filter pairs, while symbols have meanings as indicated in the legend, with combinations of the different symbols possible. Objects with strongly discrepant individual independent flux estimates are shown as faded. Lower panel: similar ratios as in the upper panel, but now using a generic NB estimation method instead of the TPV method.
Current usage metrics show cumulative count of Article Views (full-text article views including HTML views, PDF and ePub downloads, according to the available data) and Abstracts Views on Vision4Press platform.
Data correspond to usage on the plateform after 2015. The current usage metrics is available 48-96 hours after online publication and is updated daily on week days.
Initial download of the metrics may take a while.