Fig. 10
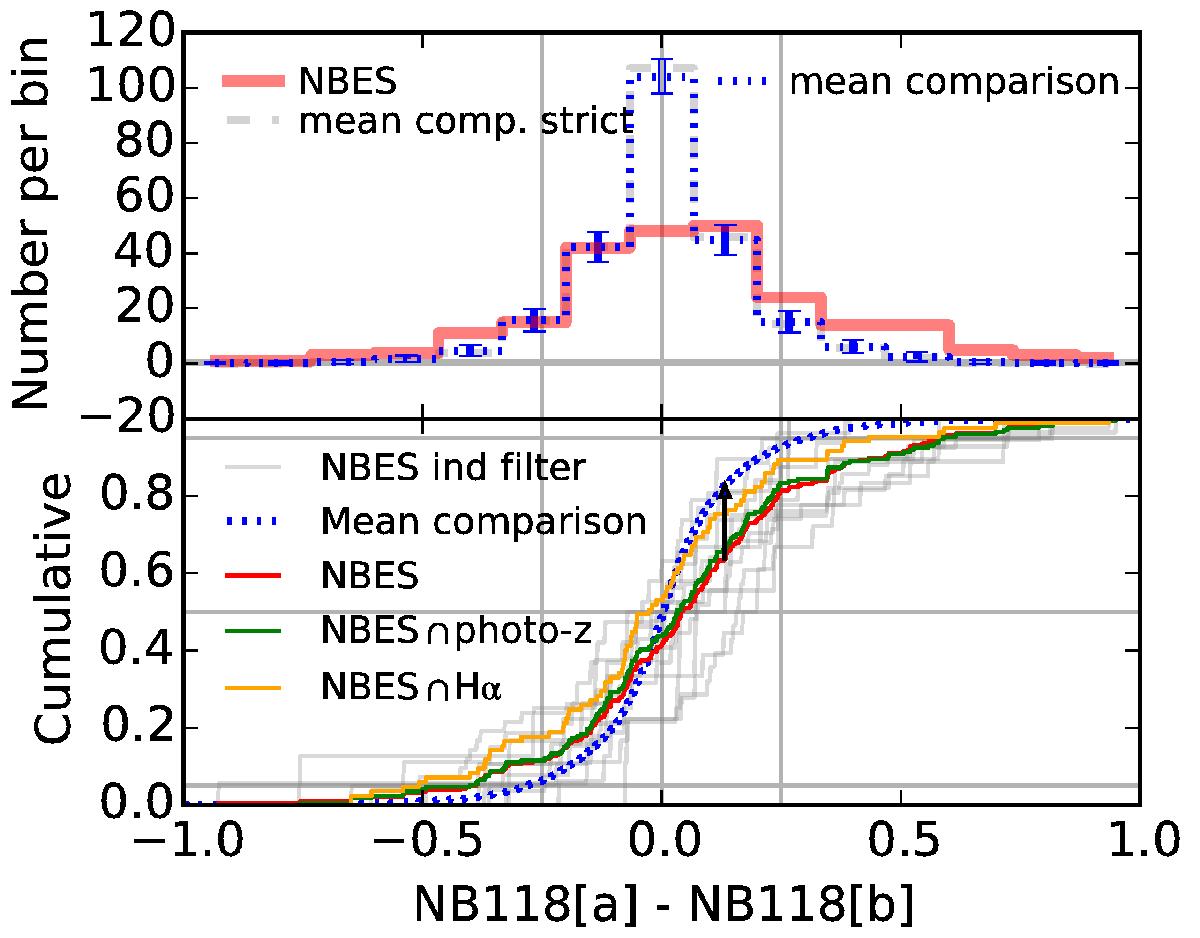
Statistical distribution of magnitude differences for objects with observations available in two different NB118 filters. Histograms are shown for the sample of 239 objects with NB excess (NBES), and for 100 comparison samples. The comparison samples have the same number of objects and distribution of stack magnitudes as the NBES in each of the 12 contributing filter combinations, but no NB excess was required. Upper: both the histogram for the NBES and the histograms obtained from the mean of the 100 comparison samples are shown. In the latter case, the standard deviation between the different samples is indicated by errorbars. Lower: cumulative distribution for the mean of the comparison samples and for the NBES sample. The maximal differences between the two samples is indicated by an arrow. In addition, for the NBES, the cumulative histograms are included for the individual filter combinations. Two subsets of the NBES are plotted.
Current usage metrics show cumulative count of Article Views (full-text article views including HTML views, PDF and ePub downloads, according to the available data) and Abstracts Views on Vision4Press platform.
Data correspond to usage on the plateform after 2015. The current usage metrics is available 48-96 hours after online publication and is updated daily on week days.
Initial download of the metrics may take a while.