Fig. 1
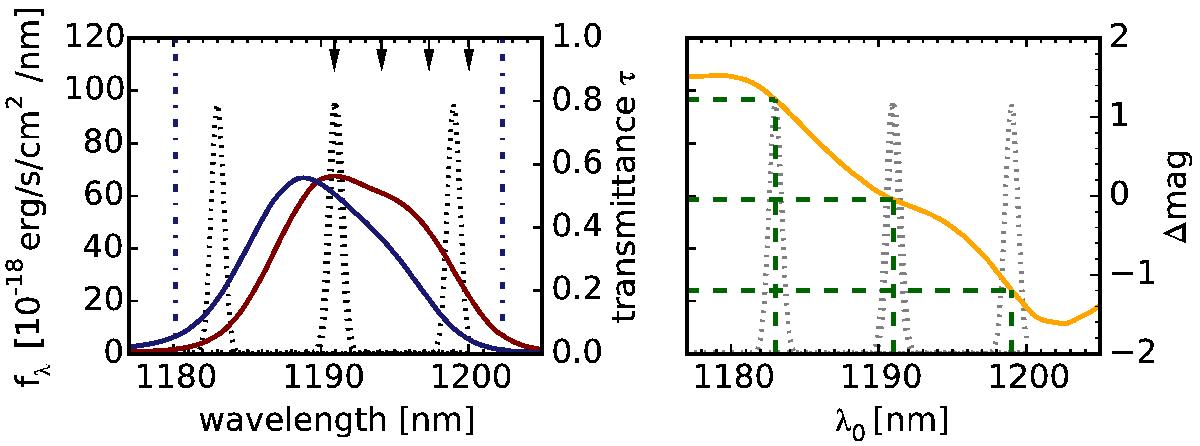
Illustration of how to obtain accurate line fluxes by using two NB filters. The left panel shows the throughput curves of two similar NB filters, superimposed on an emission line shifted to different wavelengths. The righthand panel shows the corresponding differences between the magnitudes measured with the two filters, Δmag, as a function of the wavelength of the emission line, λ0. Here, the green dashed lines indicate how a measurement of Δmag can be used to determine the wavelength of the line, which in turn can be used to estimate its flux using the throughput curves on the left. The shown filter combination is the filter pair 14 and 15 of the NB118 filters, where 15 is the bluer one. The meaning of the small arrows is described in Sect. 4.3.1 and the two vertical lines in Appendix B.
Current usage metrics show cumulative count of Article Views (full-text article views including HTML views, PDF and ePub downloads, according to the available data) and Abstracts Views on Vision4Press platform.
Data correspond to usage on the plateform after 2015. The current usage metrics is available 48-96 hours after online publication and is updated daily on week days.
Initial download of the metrics may take a while.